
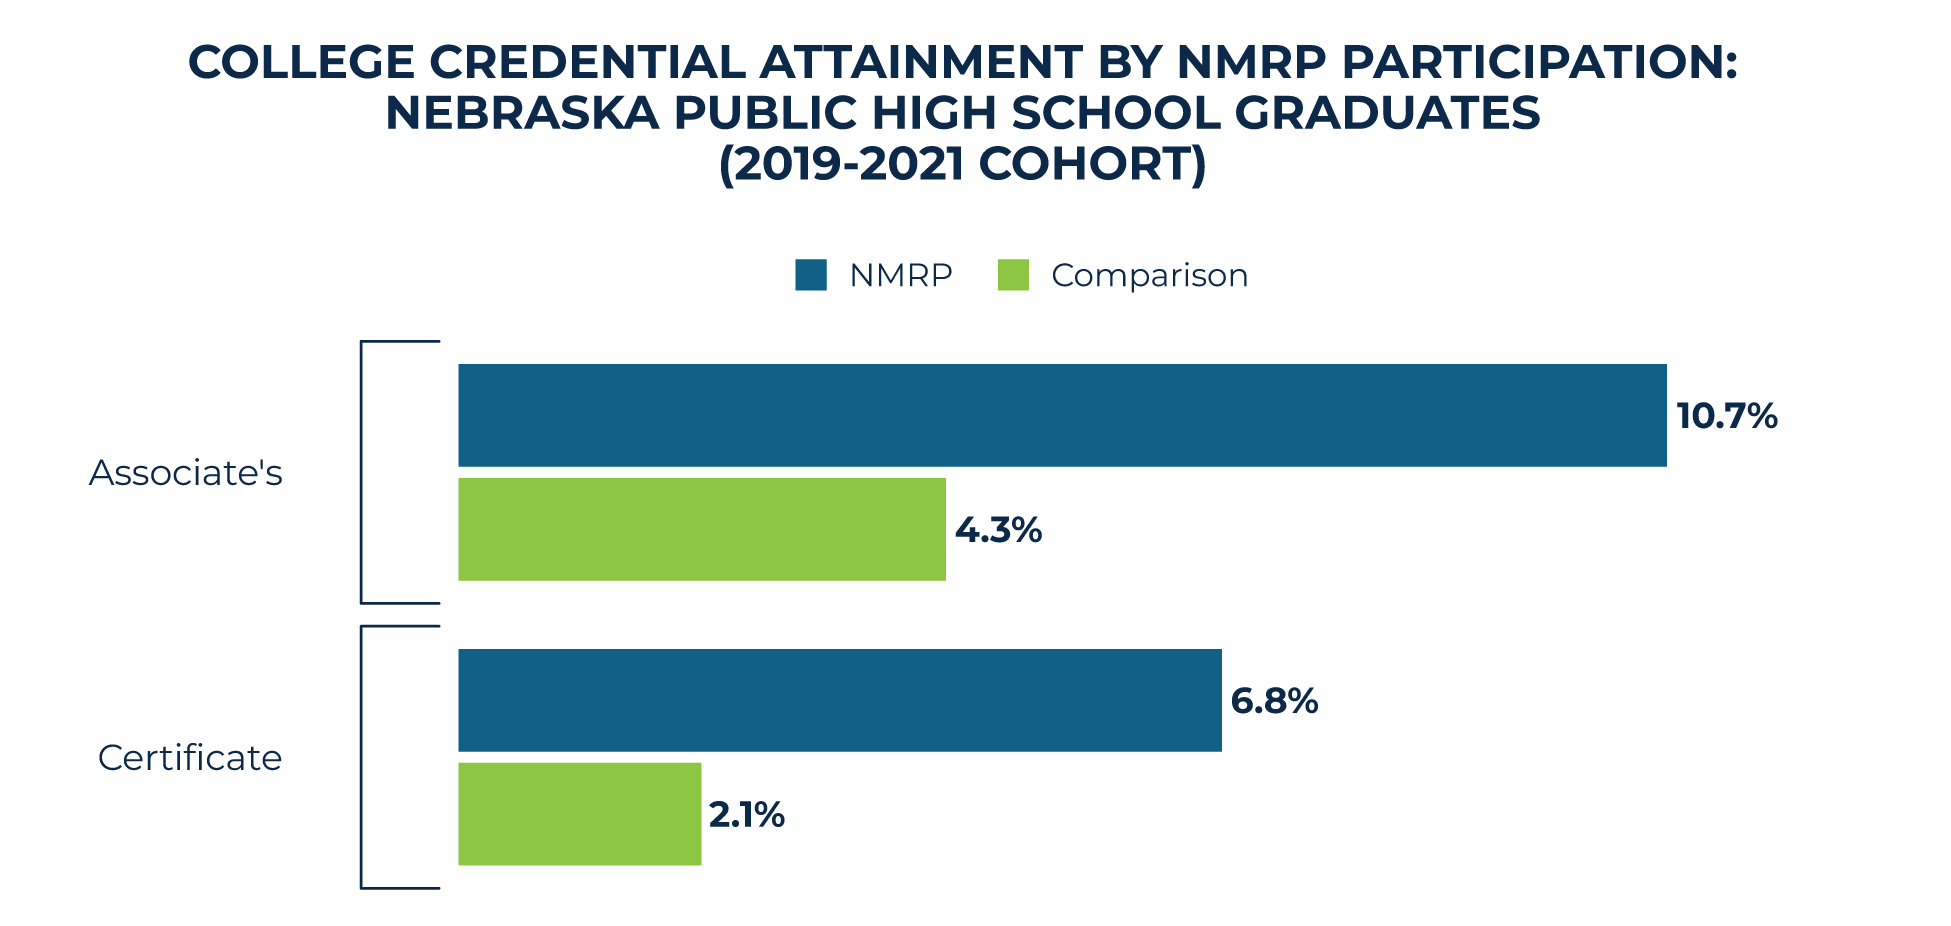
2026 NMRP Attainment
Nebraska Math Readiness Project participants have higher attainment rates for two-year certificates & associate degrees compared to their counterparts. For more about NMRP, visit: https://insights.nswers.org/evaluations/nmrpmcc2026.
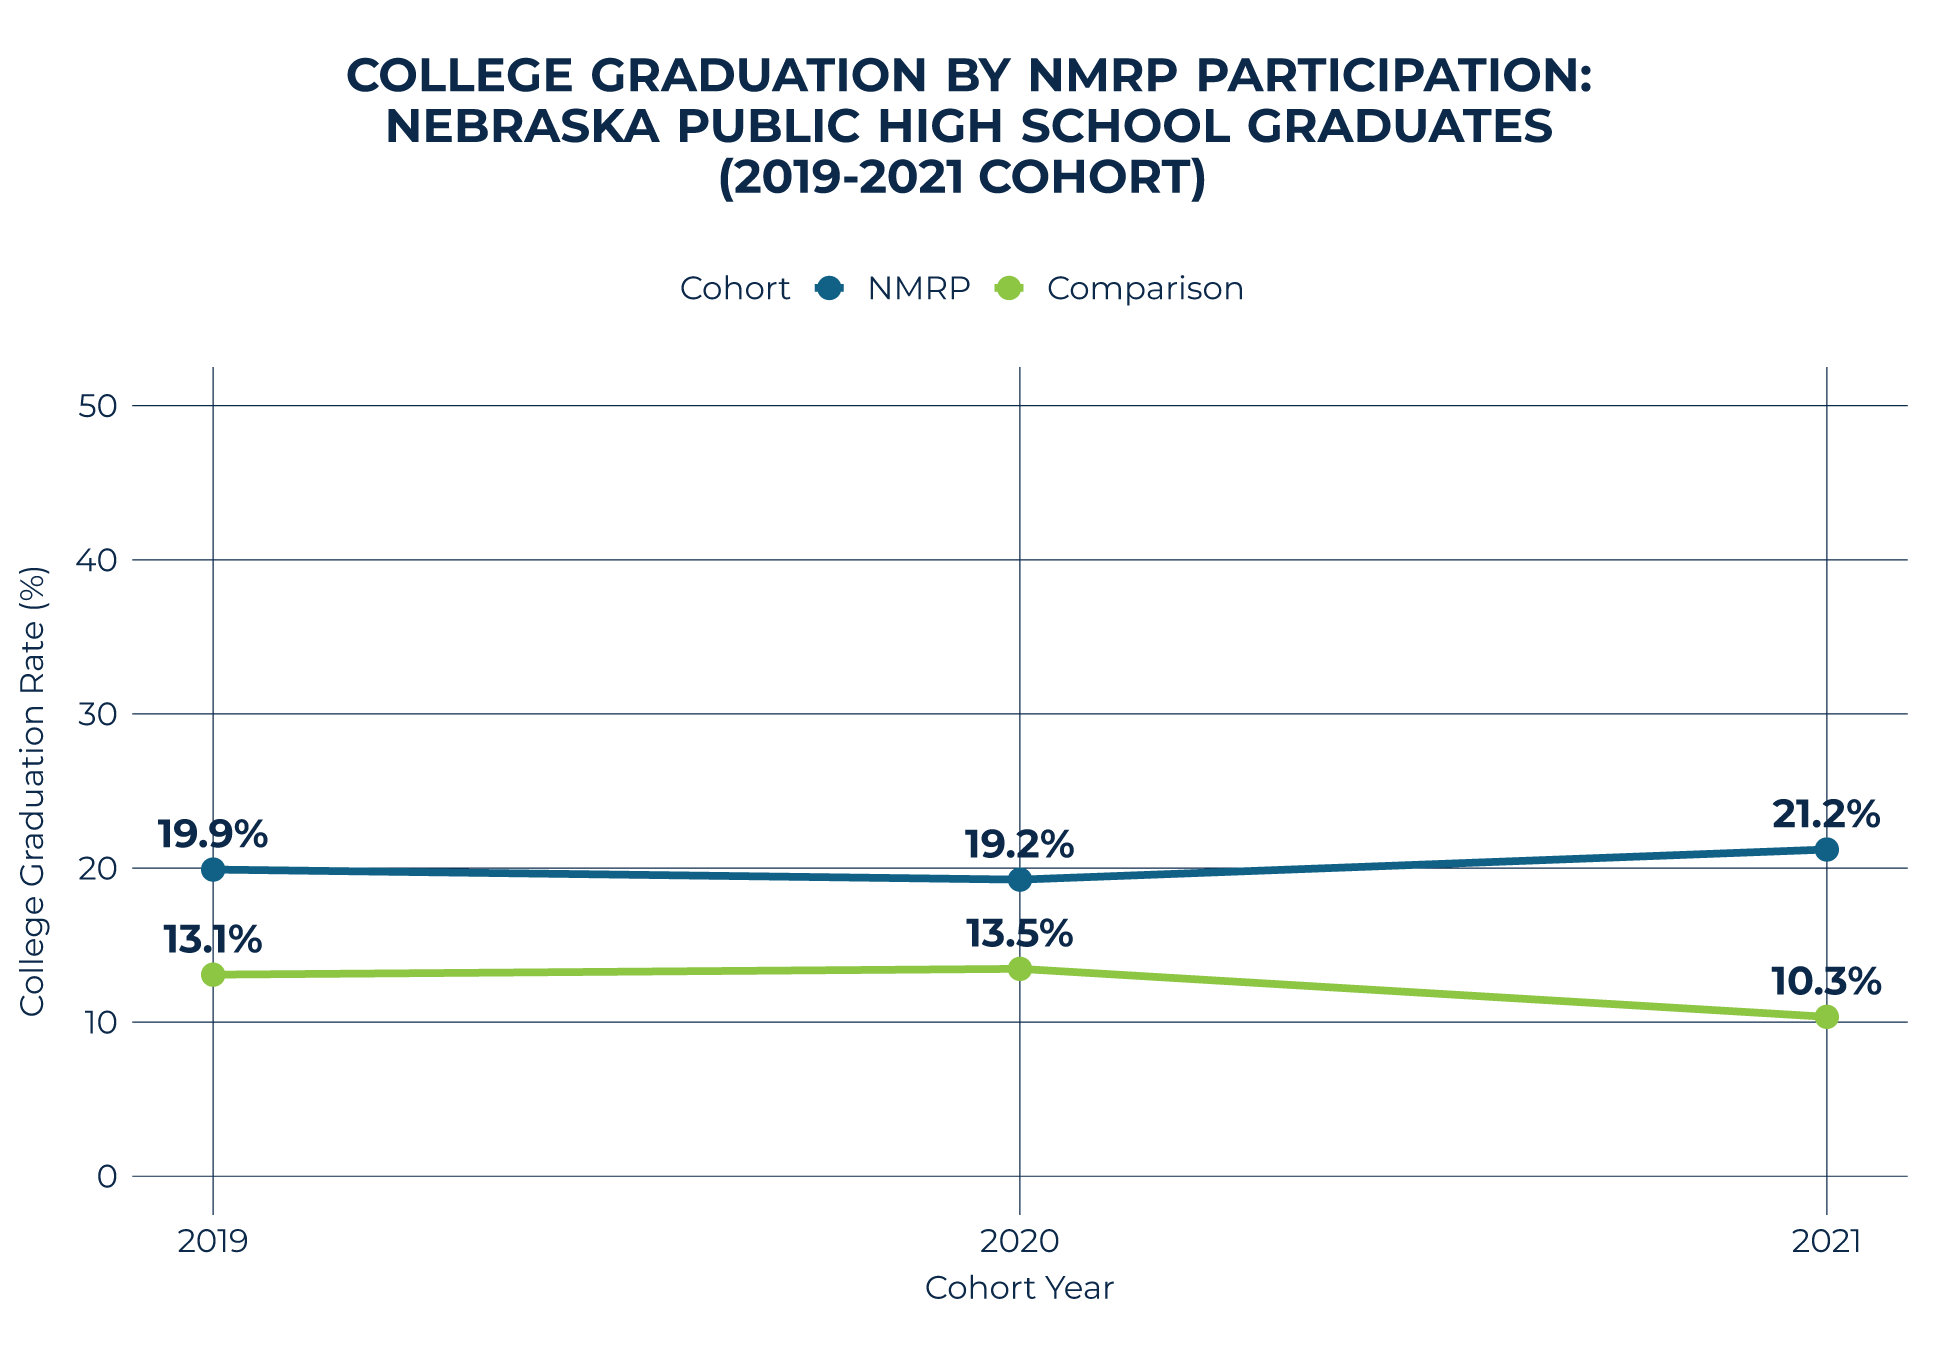
2026 NMRP College Grad
On average, the college graduation rate of Nebraska Math Readiness Project participants is 7 percentage points higher than their peers. Learn more about NMRP: https://insights.nswers.org/evaluations/nmrpmcc2026.
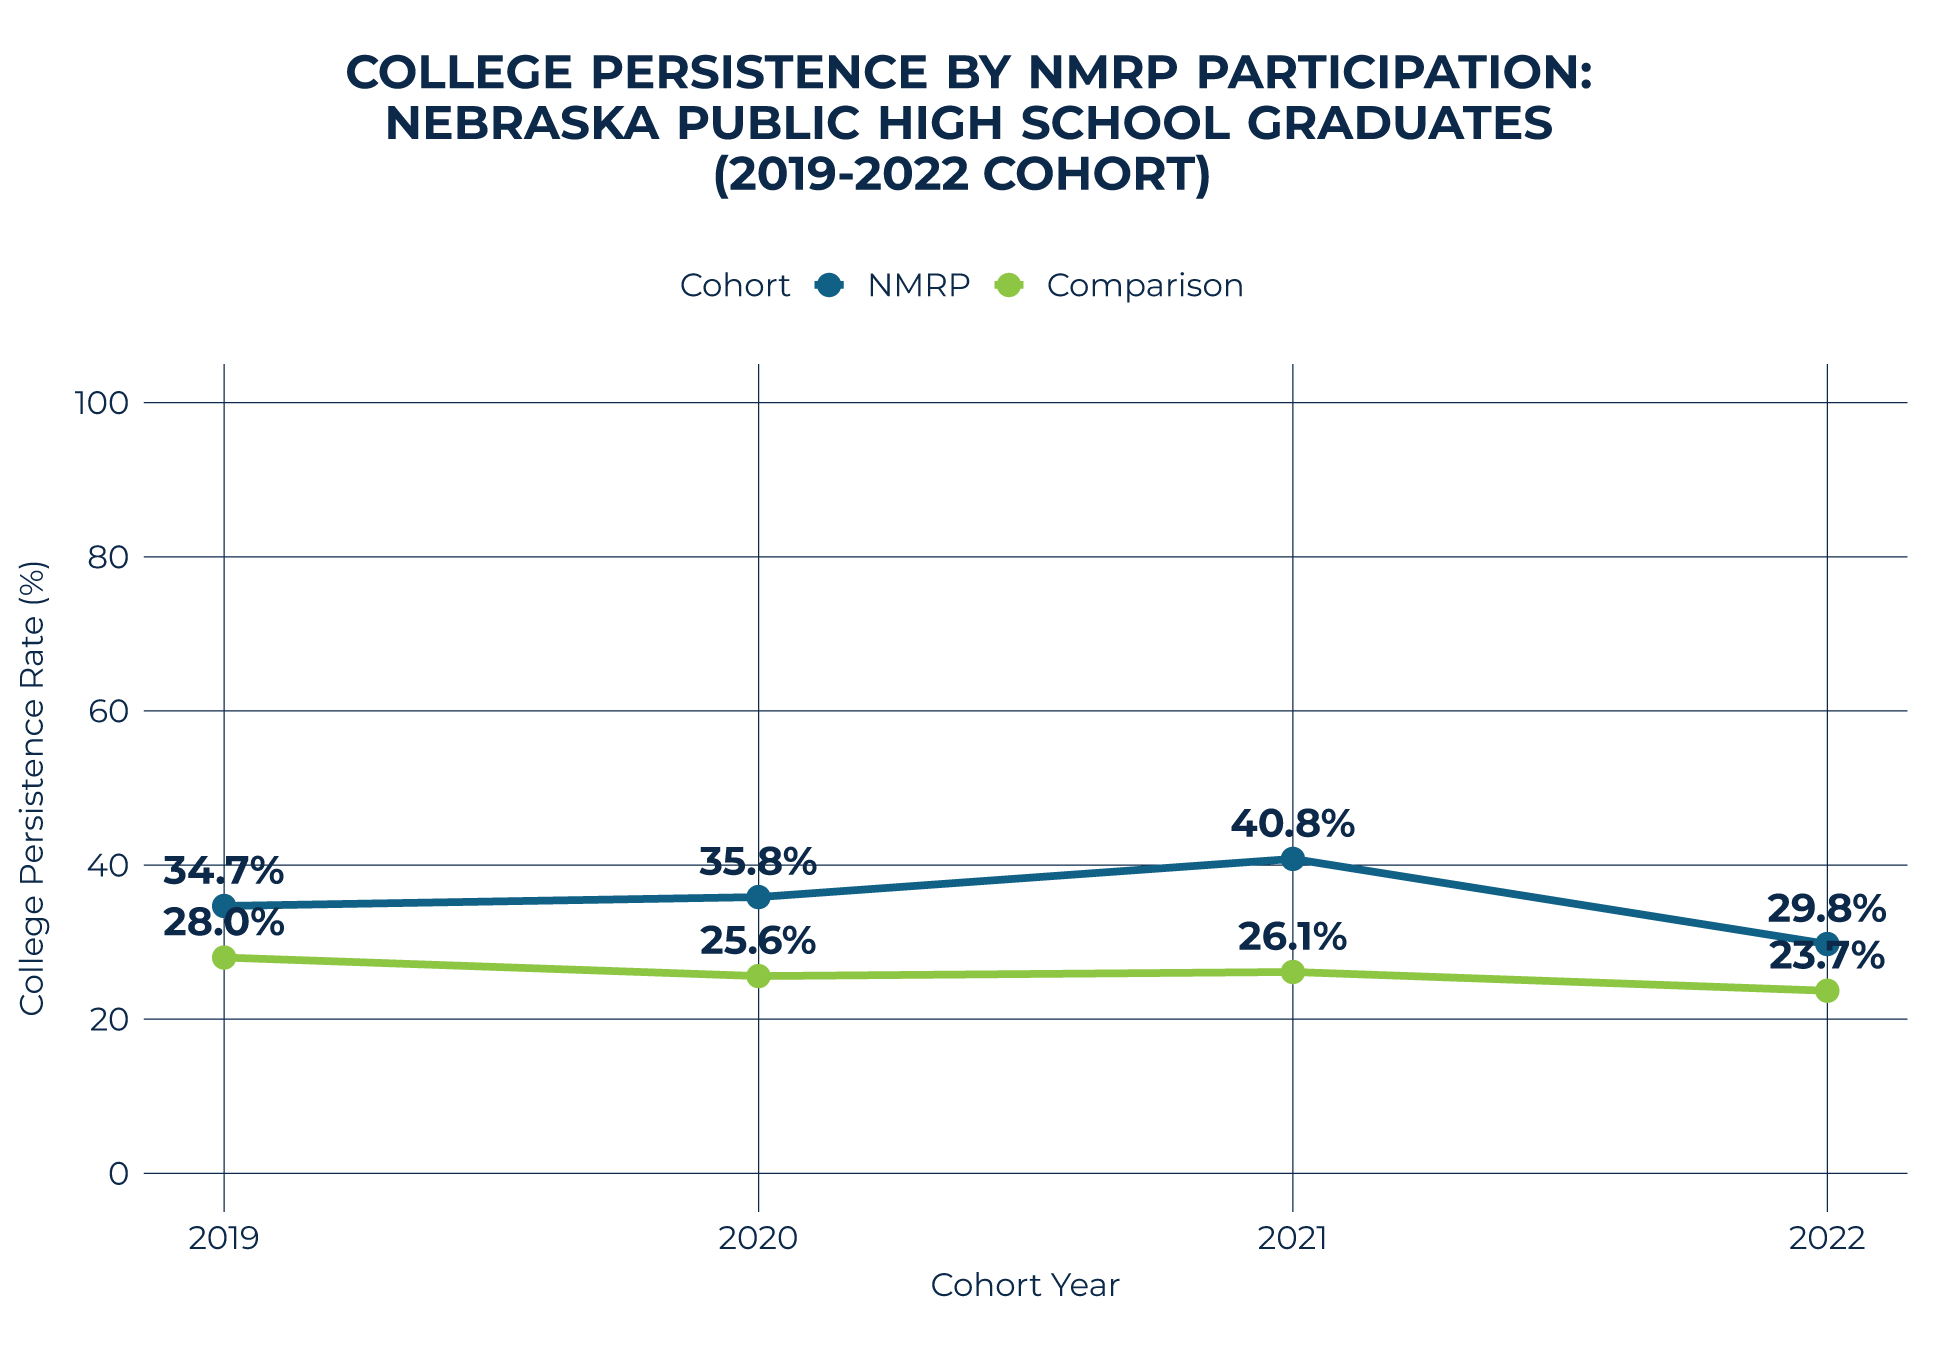
2026 NMRP College Persistence
Nebraska Math Readiness Project participants have higher rates of college persistence than their comparison group. Learn more about NMRP here: https://insights.nswers.org/evaluations/nmrpmcc2026.
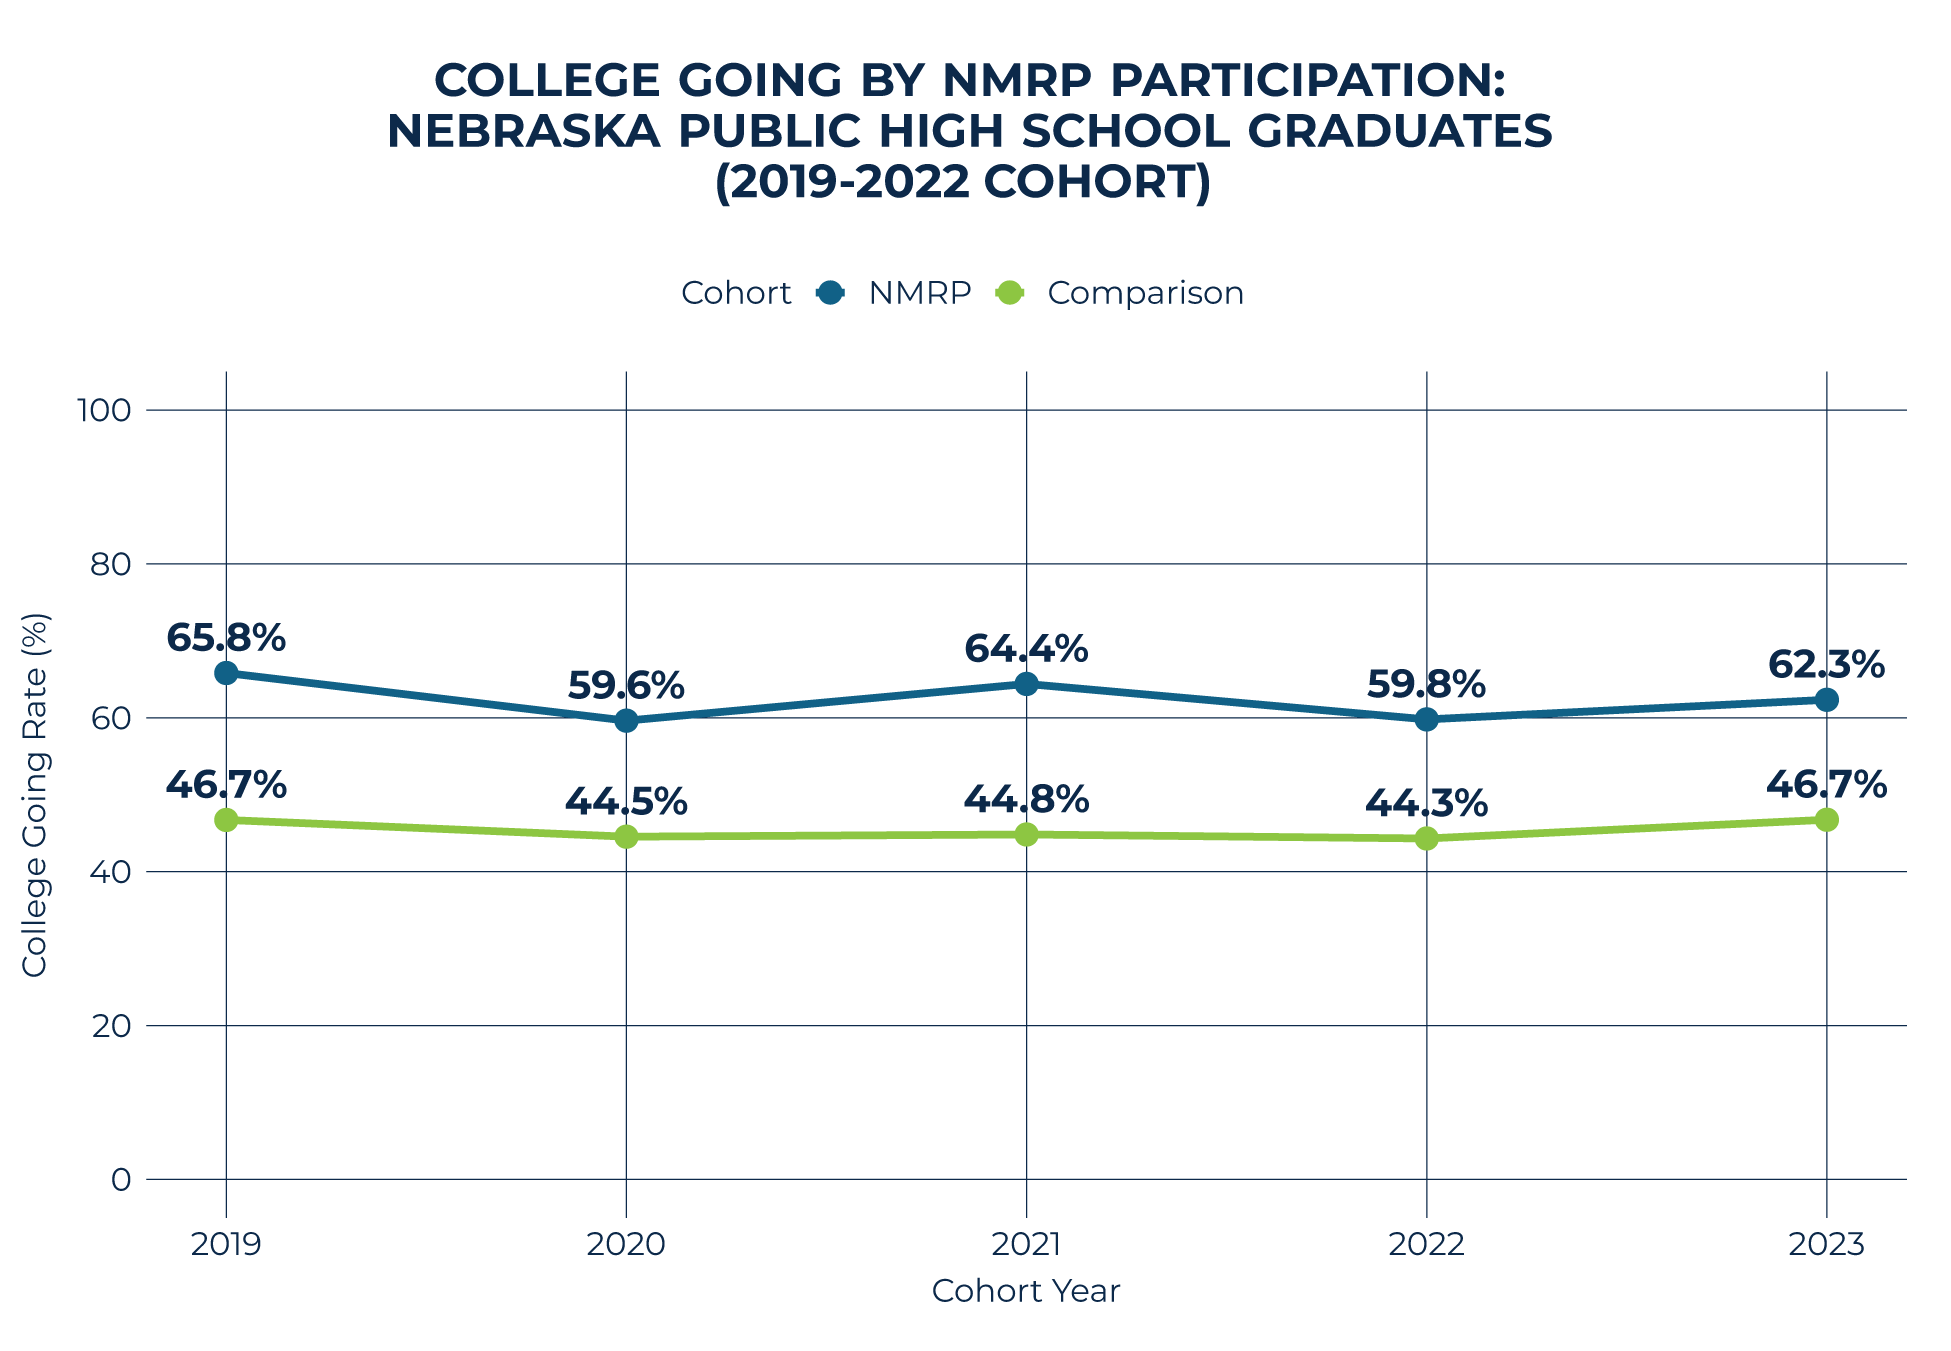
2026 NMRP College Going
Nebraska Math Readiness Project participants consistently demonstrate higher college going rates than their peers. See the additional positive effects of NMRP at: https://insights.nswers.org/evaluations/nmrpmcc2026.
2026 NMRP High School Grad
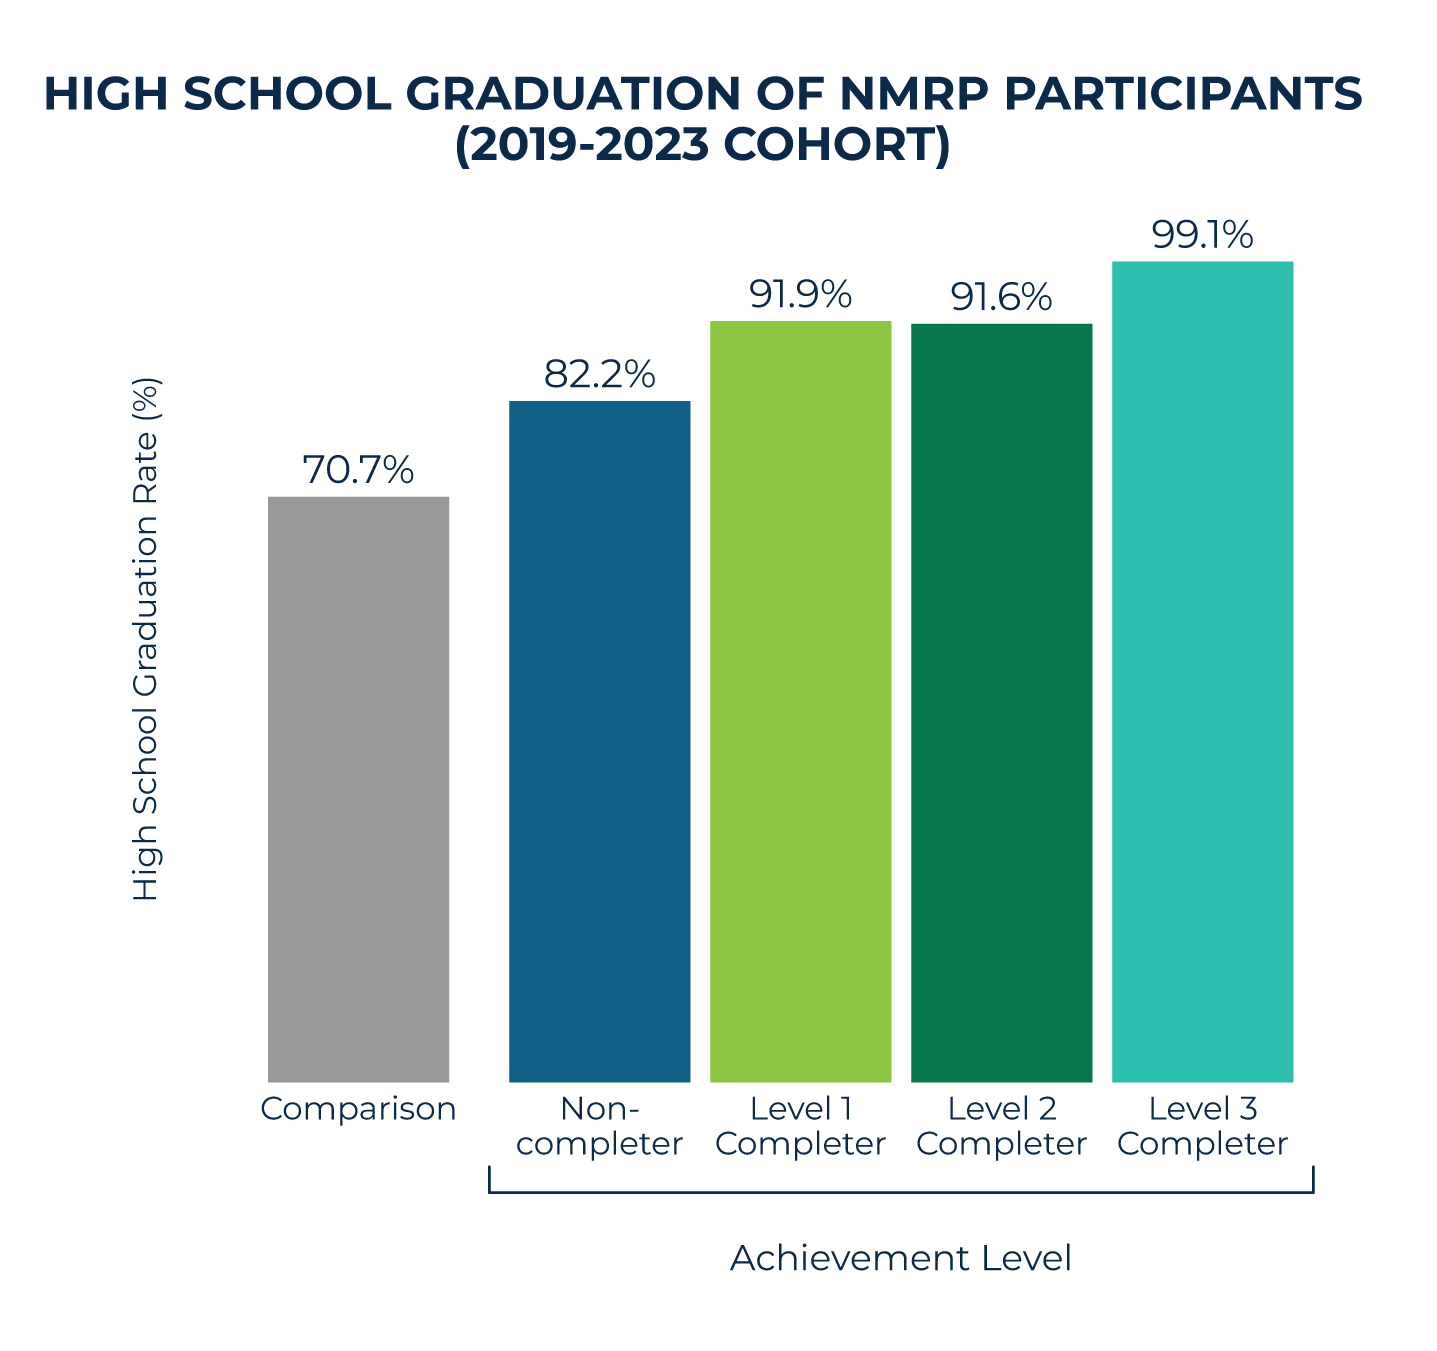
Higher Nebraska Math Readiness Project achievement levels are associated with higher high school graduation rates (99.1% at Level 3 compared to 70.7% for peers)! Learn more about NMRP: https://insights.nswers.org/evaluations/nmrpmcc2026.
2026 NMRP Track
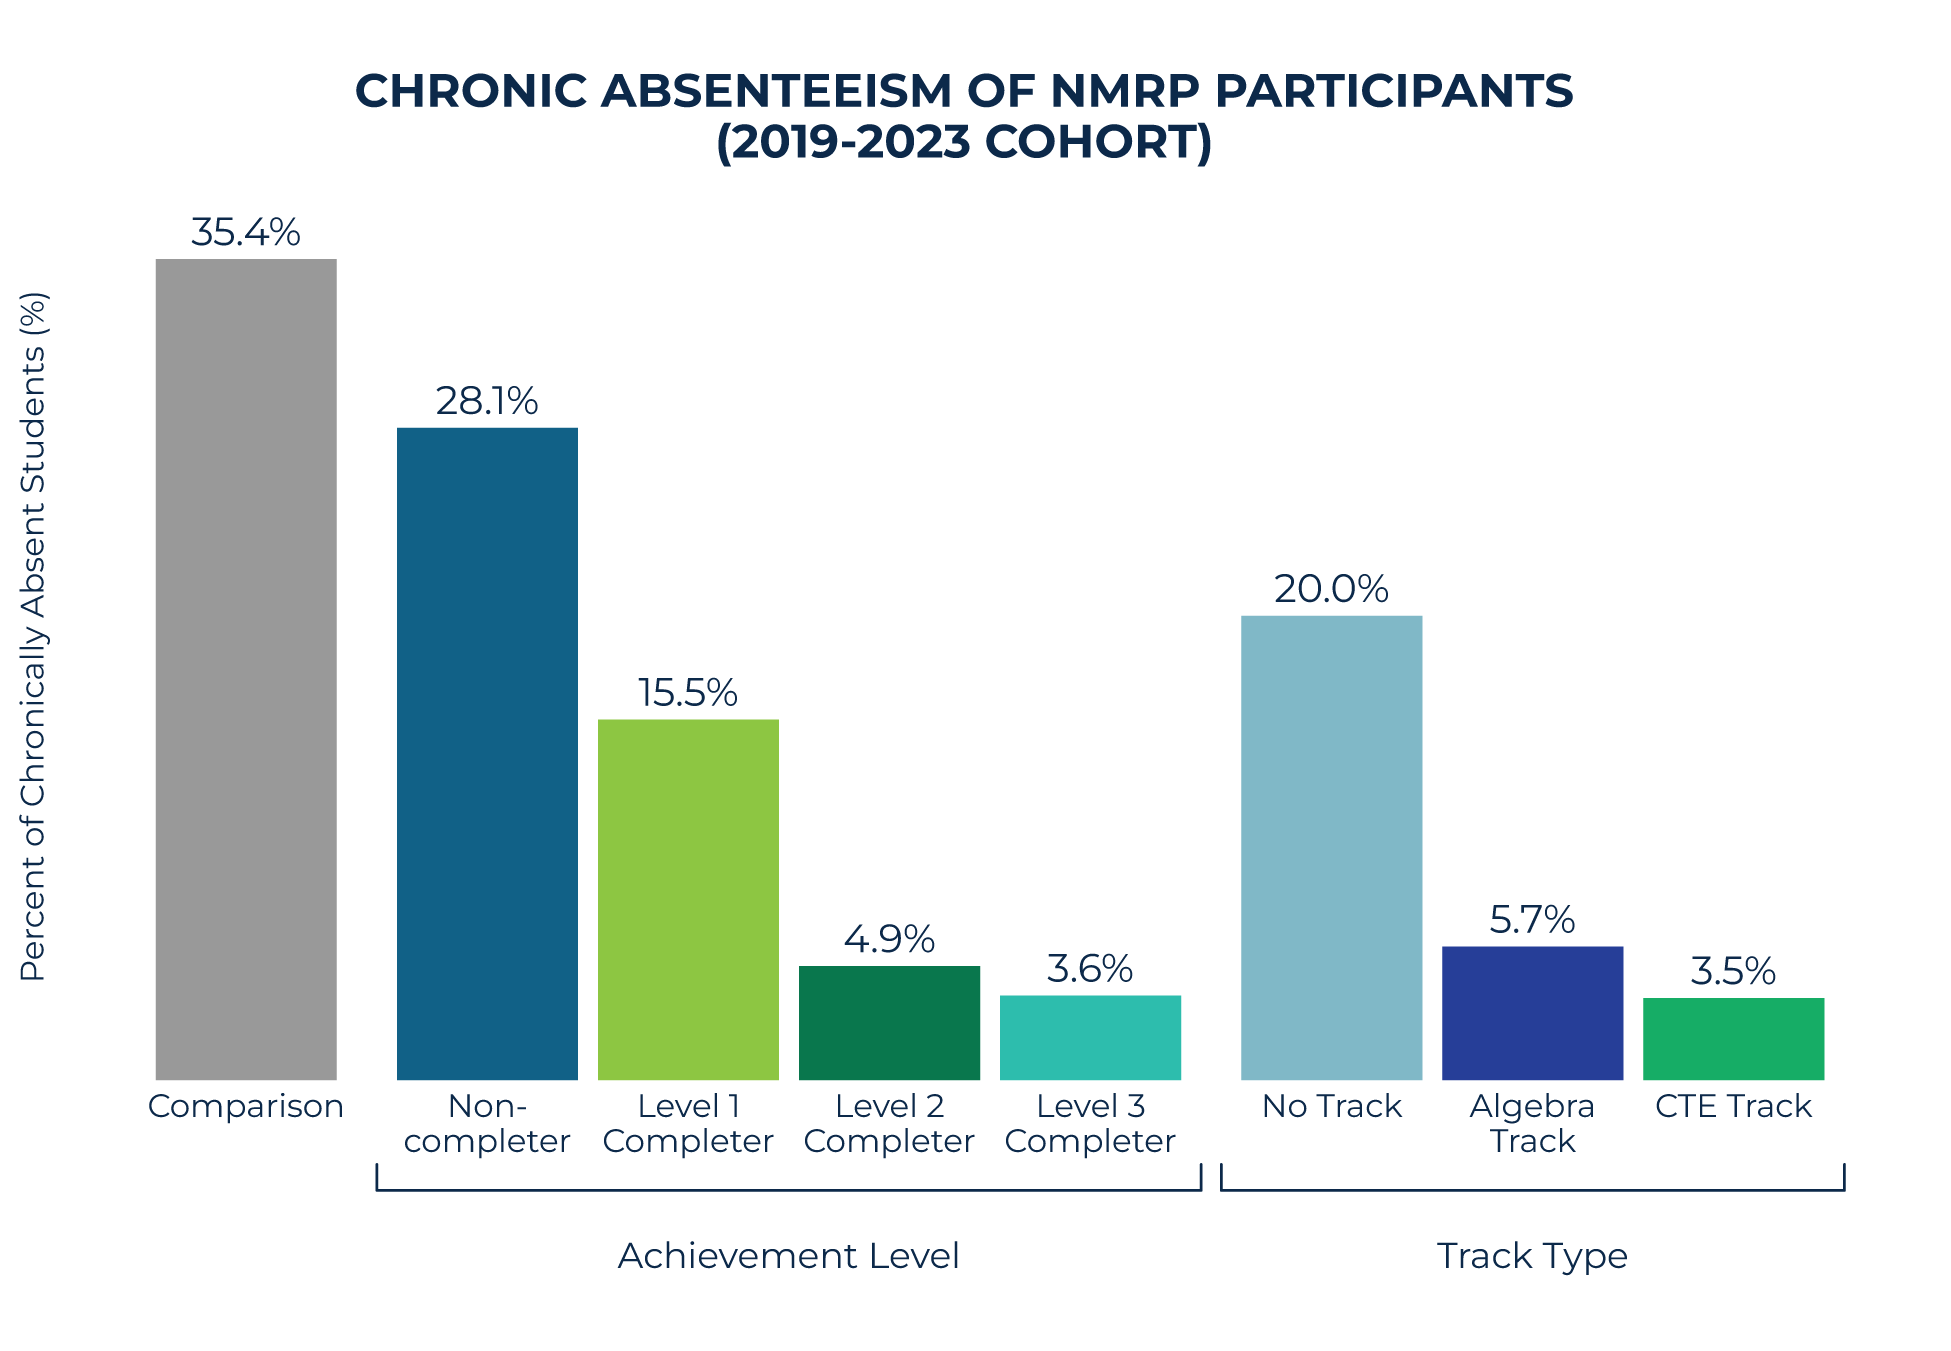
Higher Nebraska Math Readiness Project achievement levels are associated with lower rates of chronic absenteeism. Students in a CTE track also have a lower percentage of chronic absenteeism (3.5%). To learn more about NMRP visit:...
2026 NMRP Gender
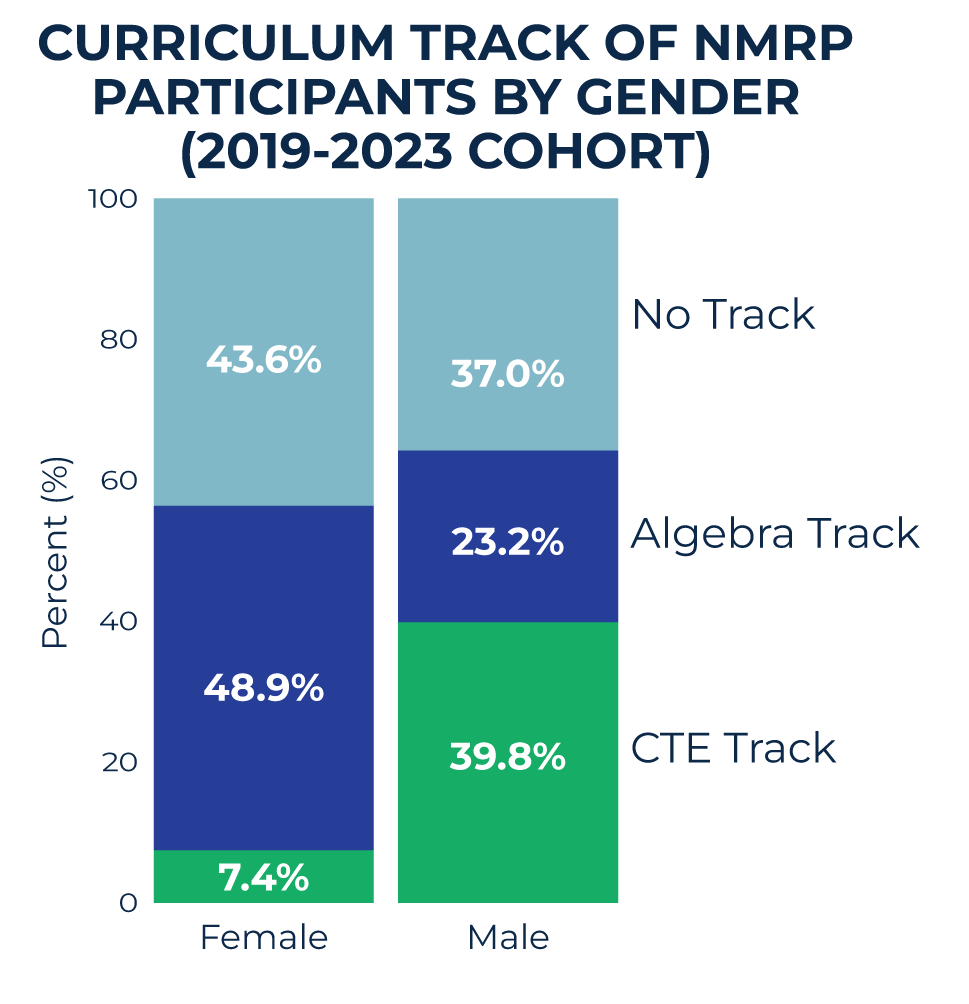
Nebraska Math Readiness Project enrollment differs by gender. Male participants select the CTE Track at a much higher rate (40%) than females (7%), while 49% of female participants enroll in the Algebra Track compared to just 23% of males. Learn more:...
2025 ACE GPAs and Graduation
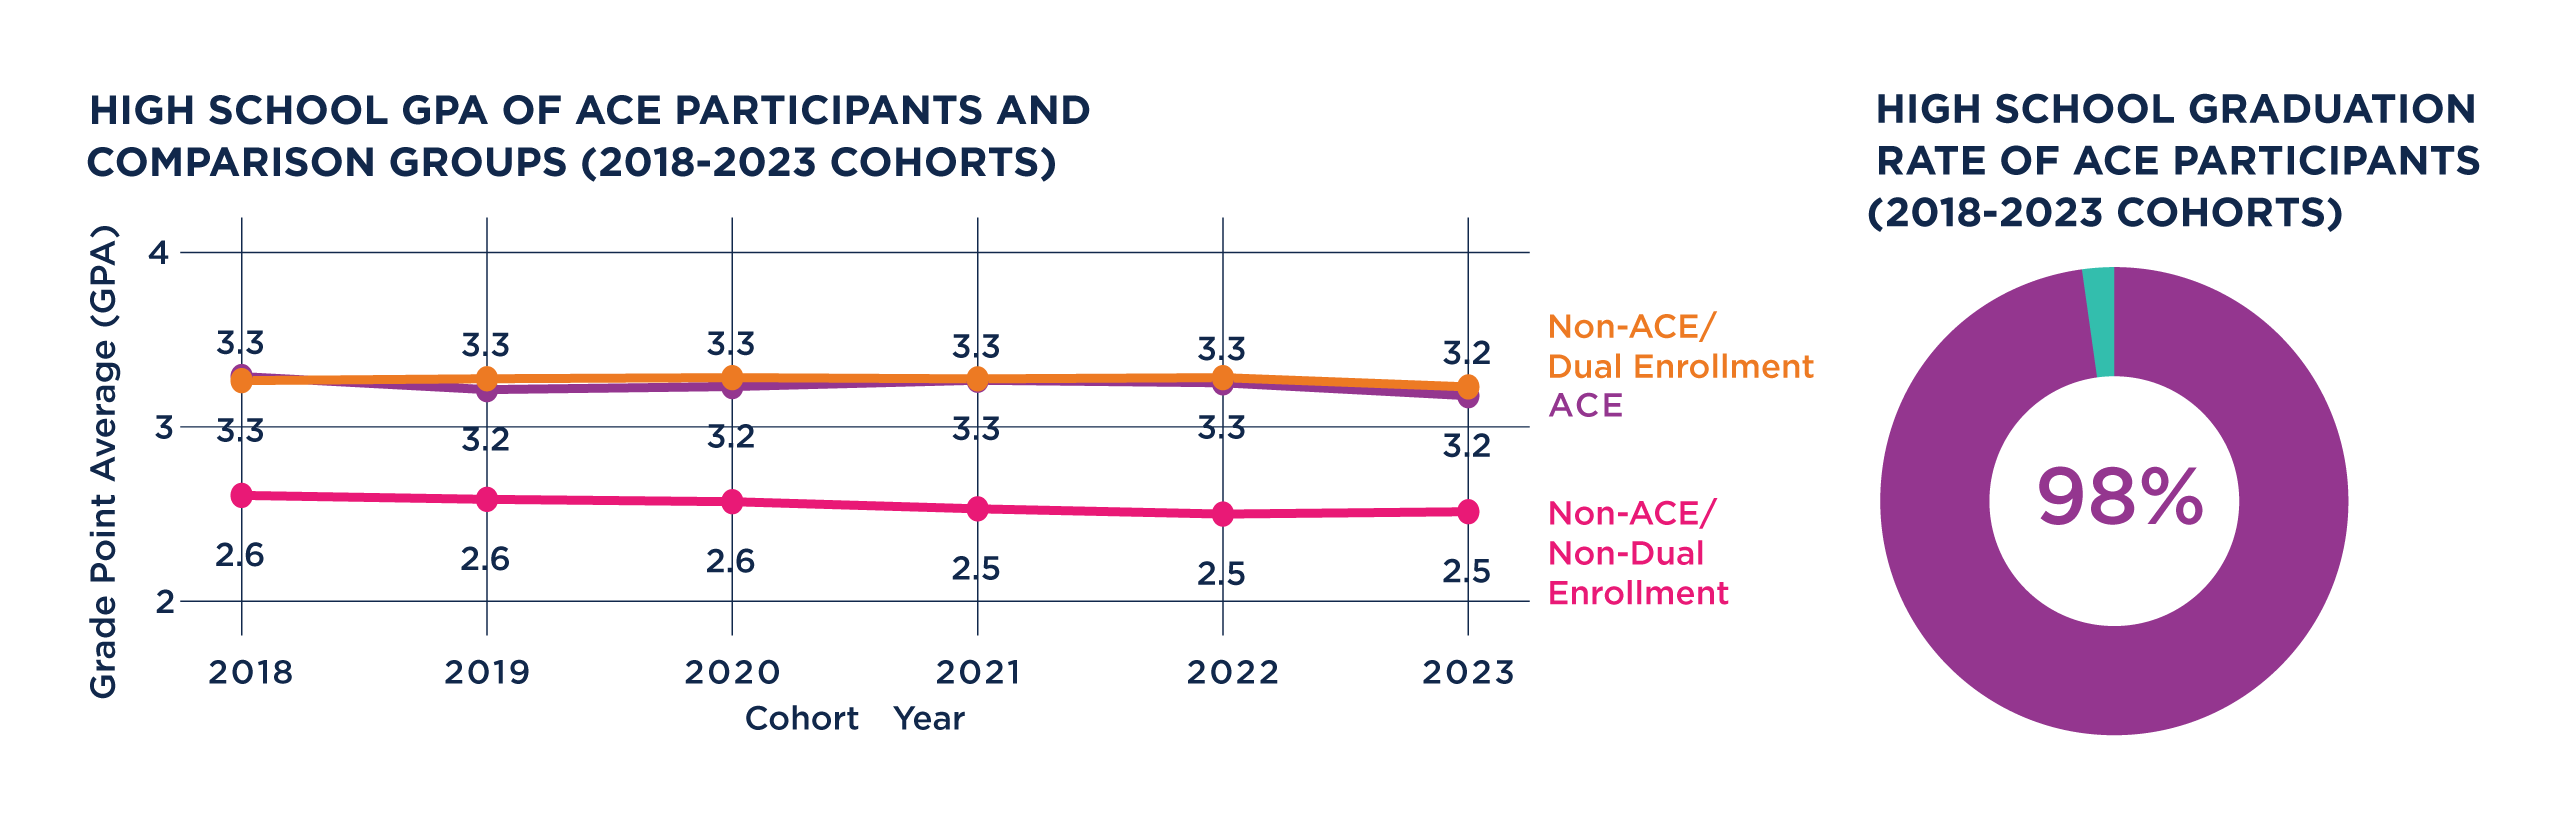
ACE participants maintain similar GPAs to non‑ACE dual‑enrollment students and higher GPAs than non‑dual‑enrollment students. ACE participants had a high overall high school graduation rate of 98%. Read the ACE report here:...
2025 ACE Gender Race
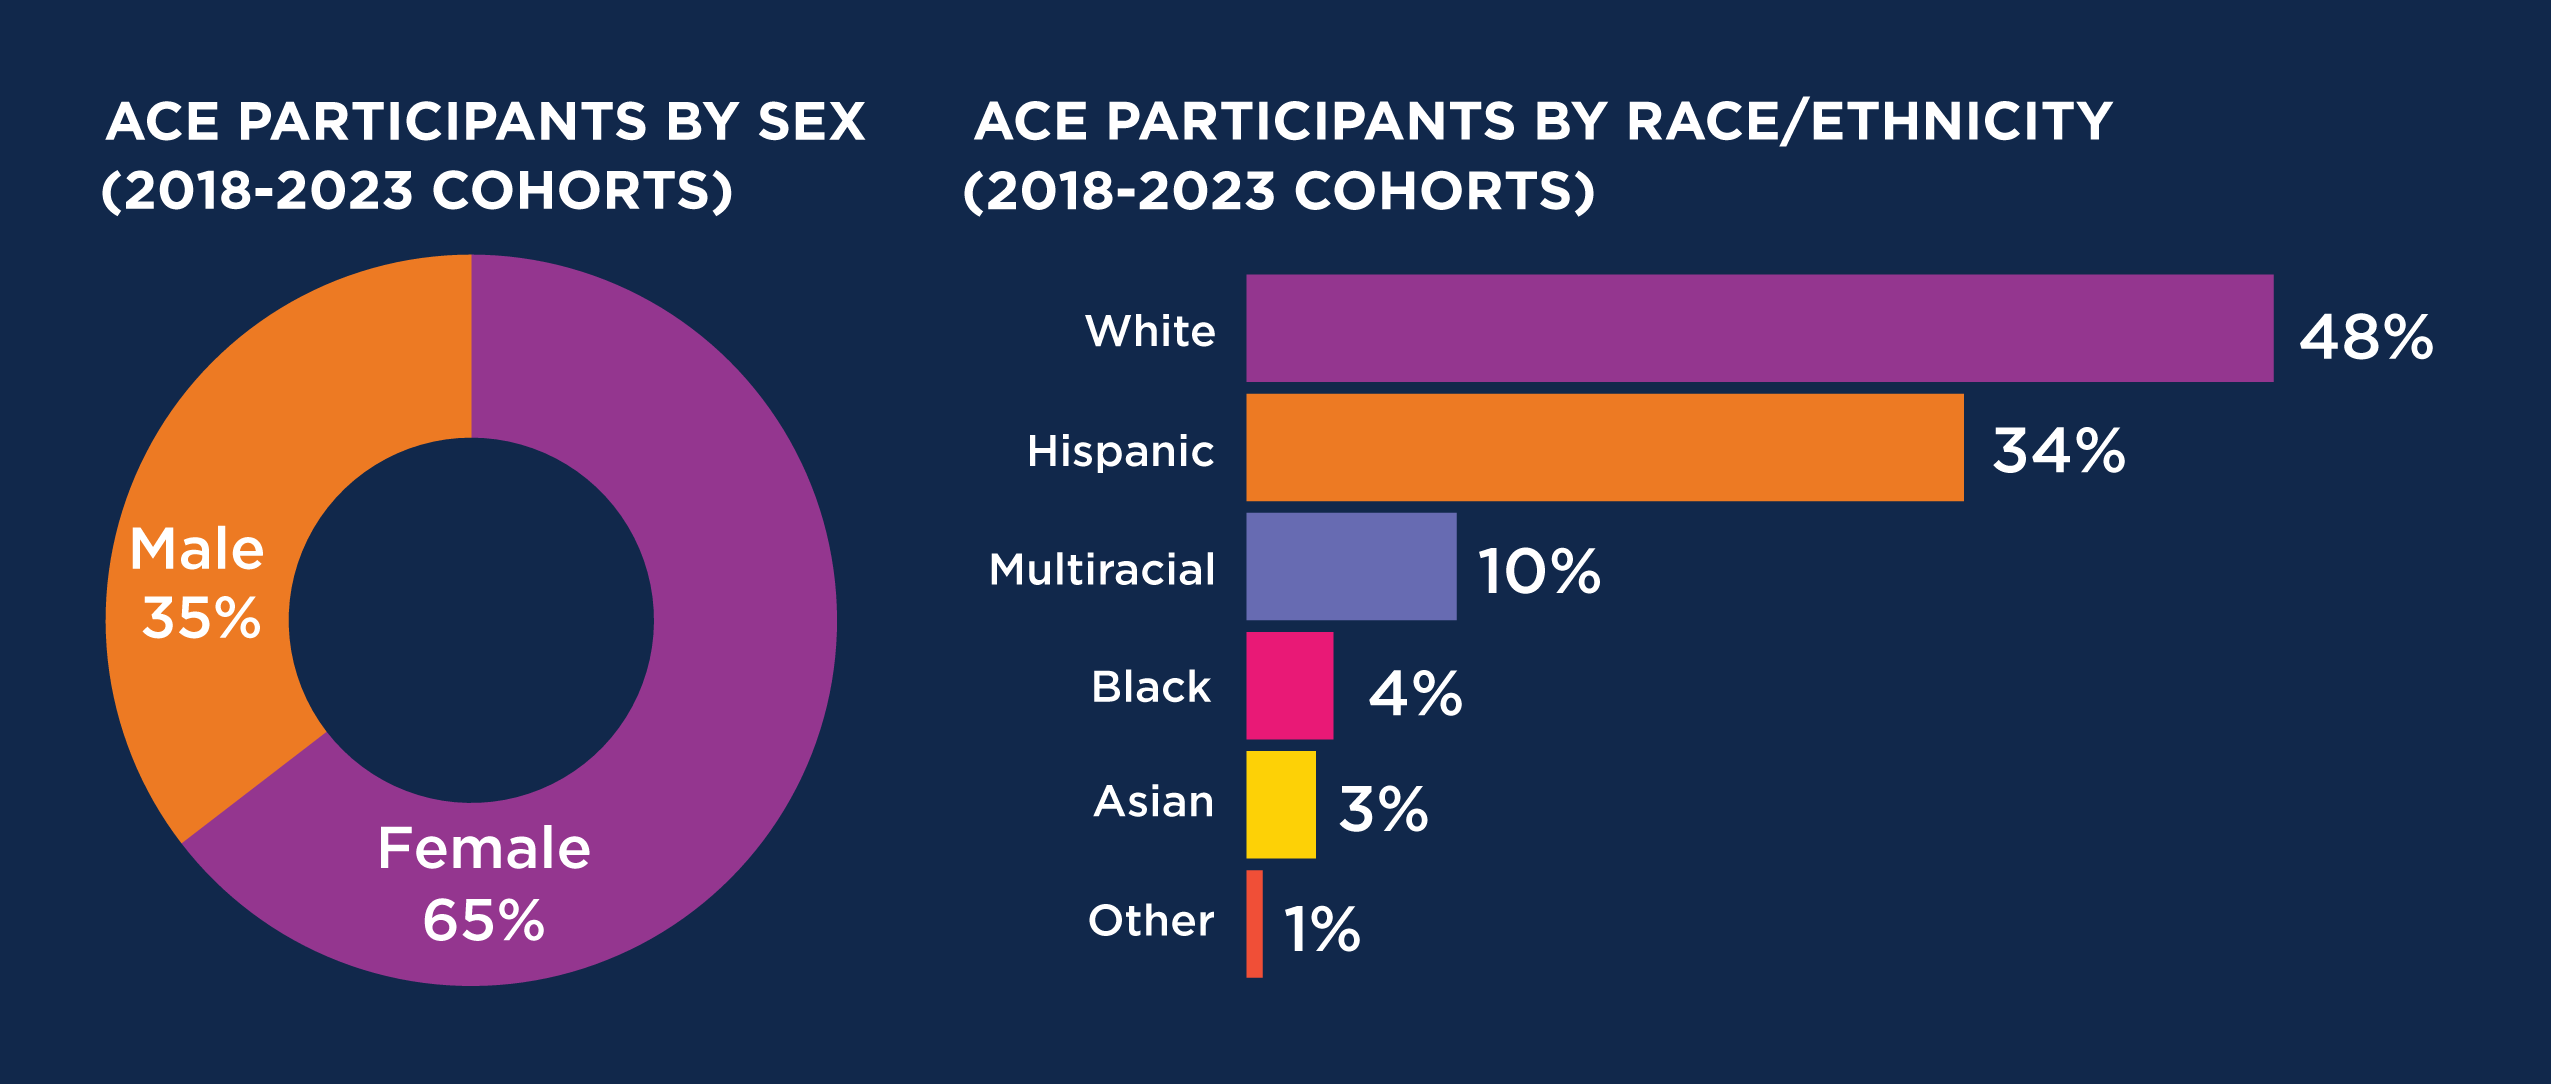
About 65% of Nebraska ACE participants are female. Roughly half of the participants are White, with strong representation from Hispanic students. Read more here: https://insights.nswers.org/evaluations/ace-2025/.

2025 ACE Urban Rural Counties
Did you know more than two‑thirds of ACE scholarship recipients are from urban Nebraska counties? Yet, the participation rate in rural counties is comparatively high given that Nebraska’s youth population is concentrated in urban areas. Read more here:...

2025 ACE Participating Postsecondary
More than half of Nebraska ACE scholarship recipients enroll in dual enrollment courses through community colleges. For more about Nebraska ACE scholars, read the program evaluation here: https://insights.nswers.org/evaluations/ace-2025/.
2025 ACE Top 10 Courses
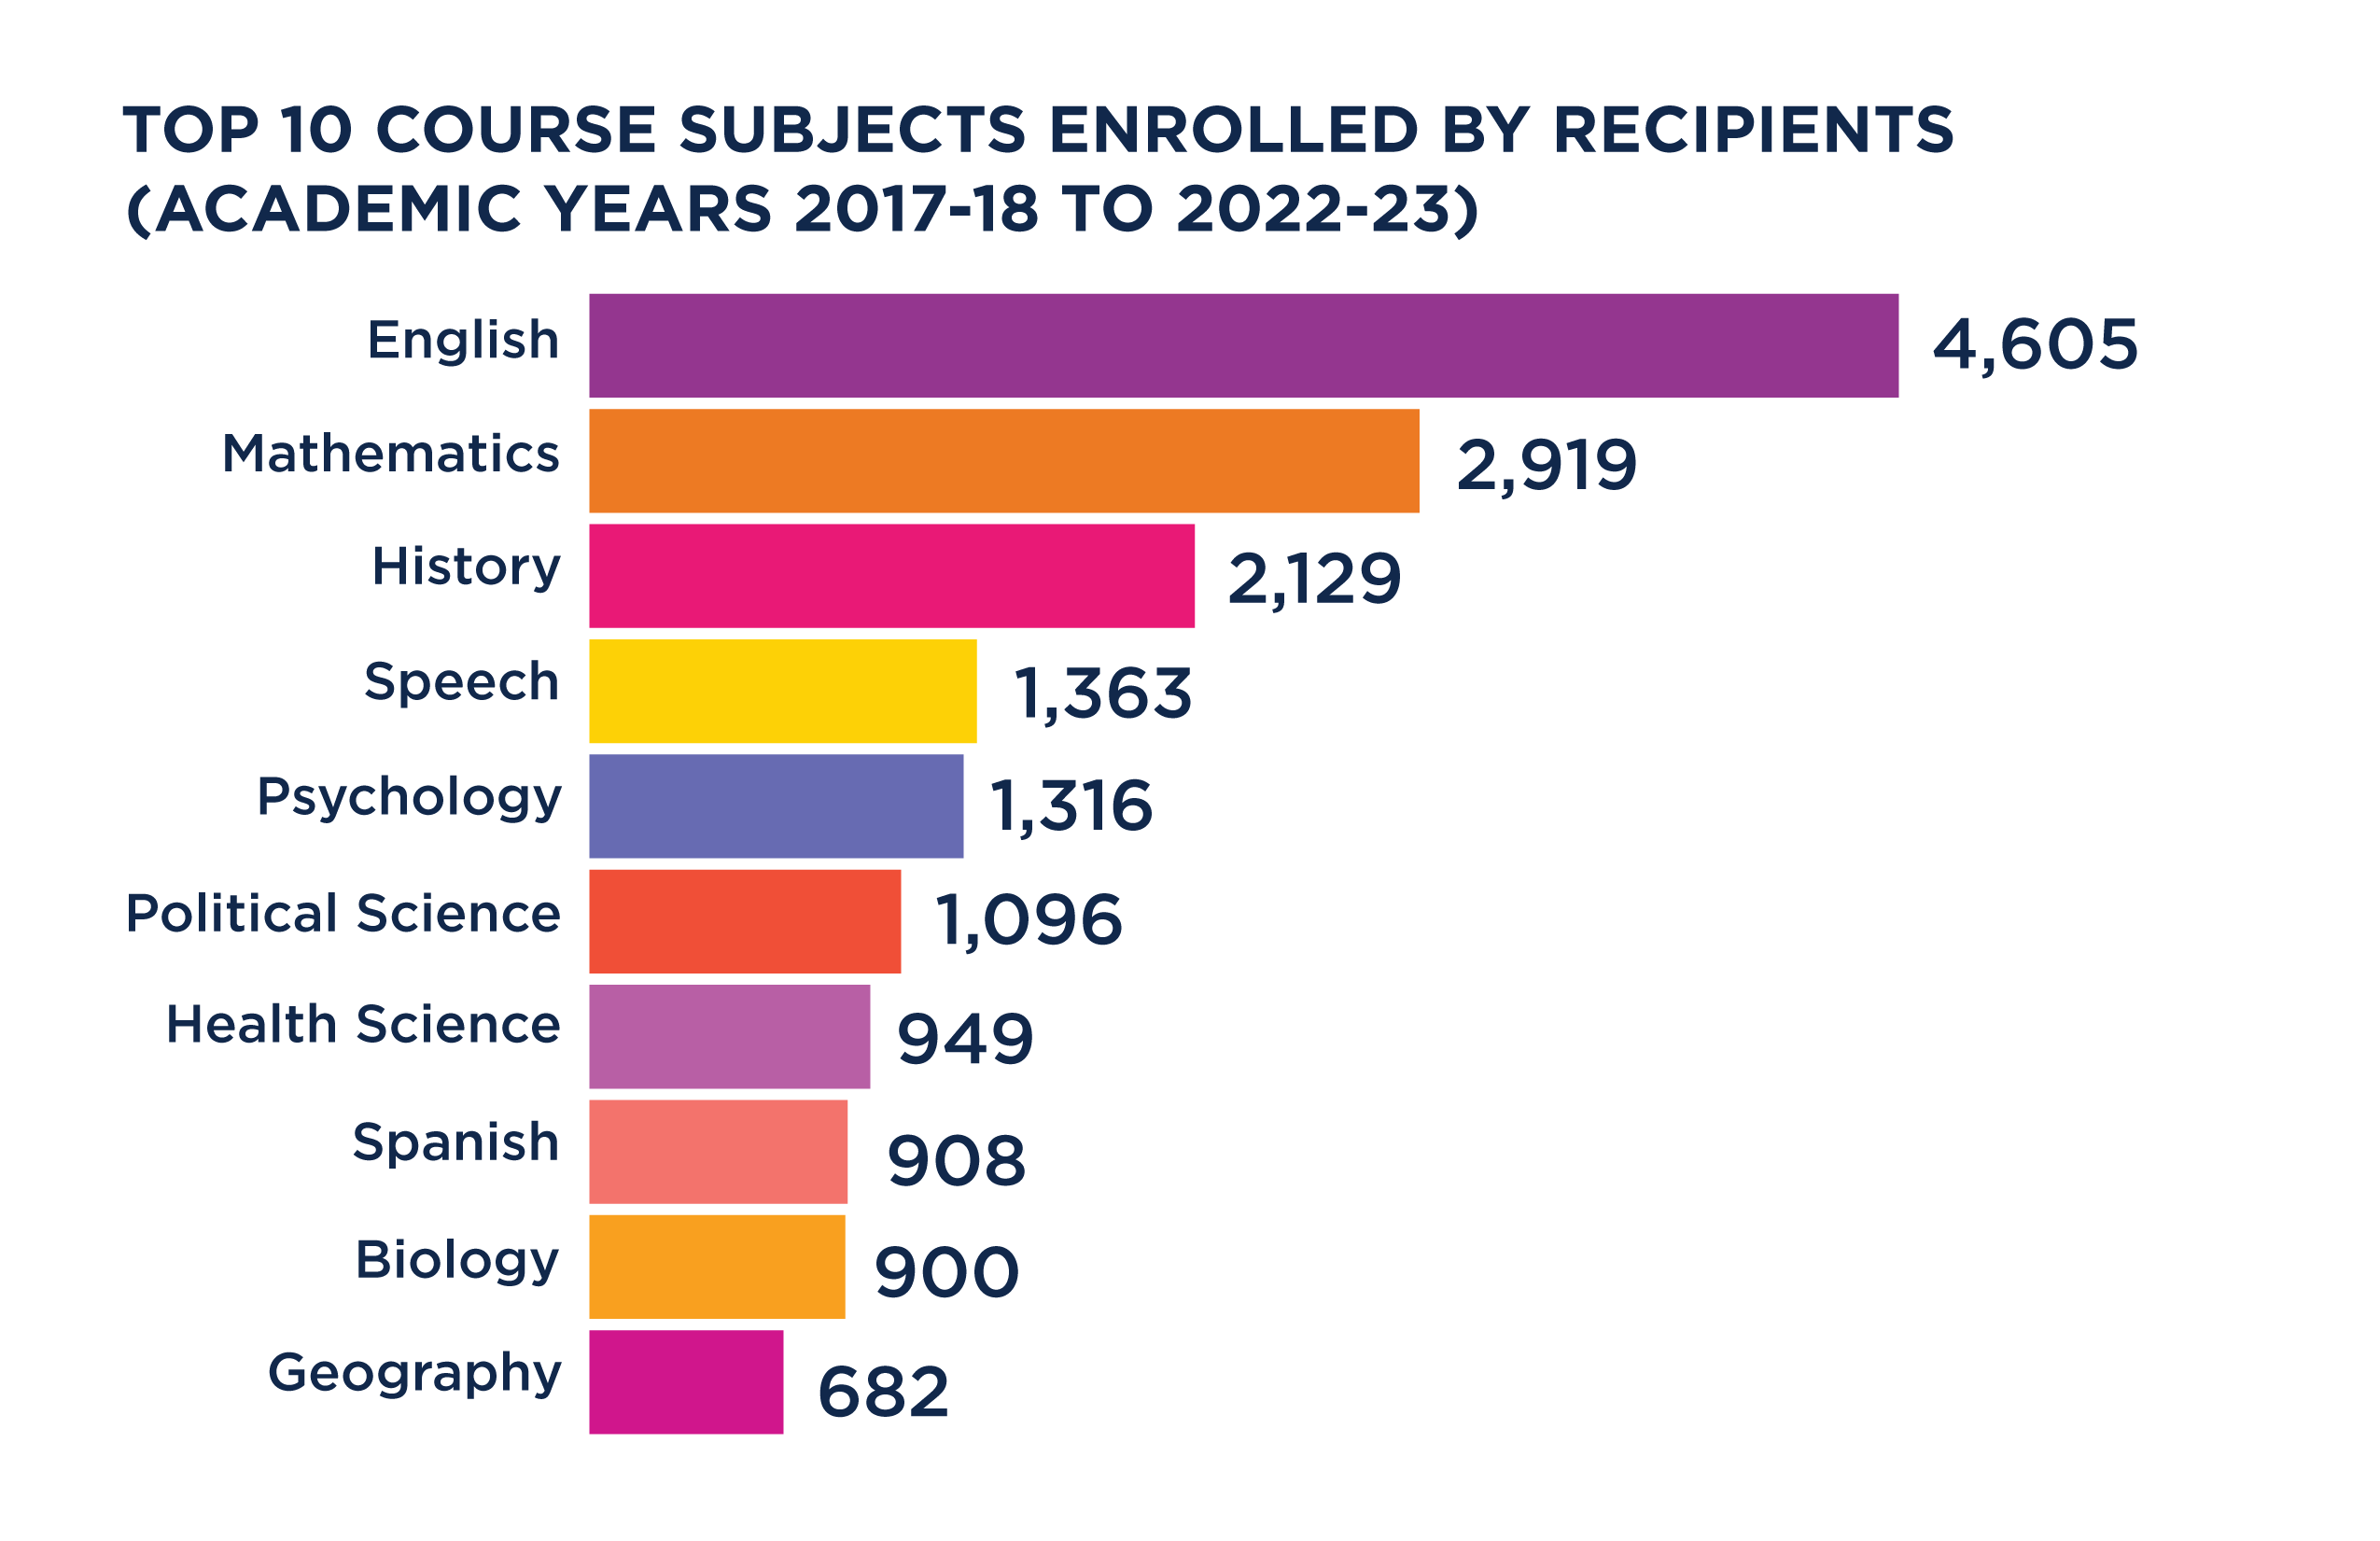
The total number of courses enrolled in and completed by Nebraska ACE scholarship recipients has increased over time. English was the most frequently enrolled subject, followed by mathematics and history. Read more about the ACE scholars:...
2025 ACE Recipients and Scholarships
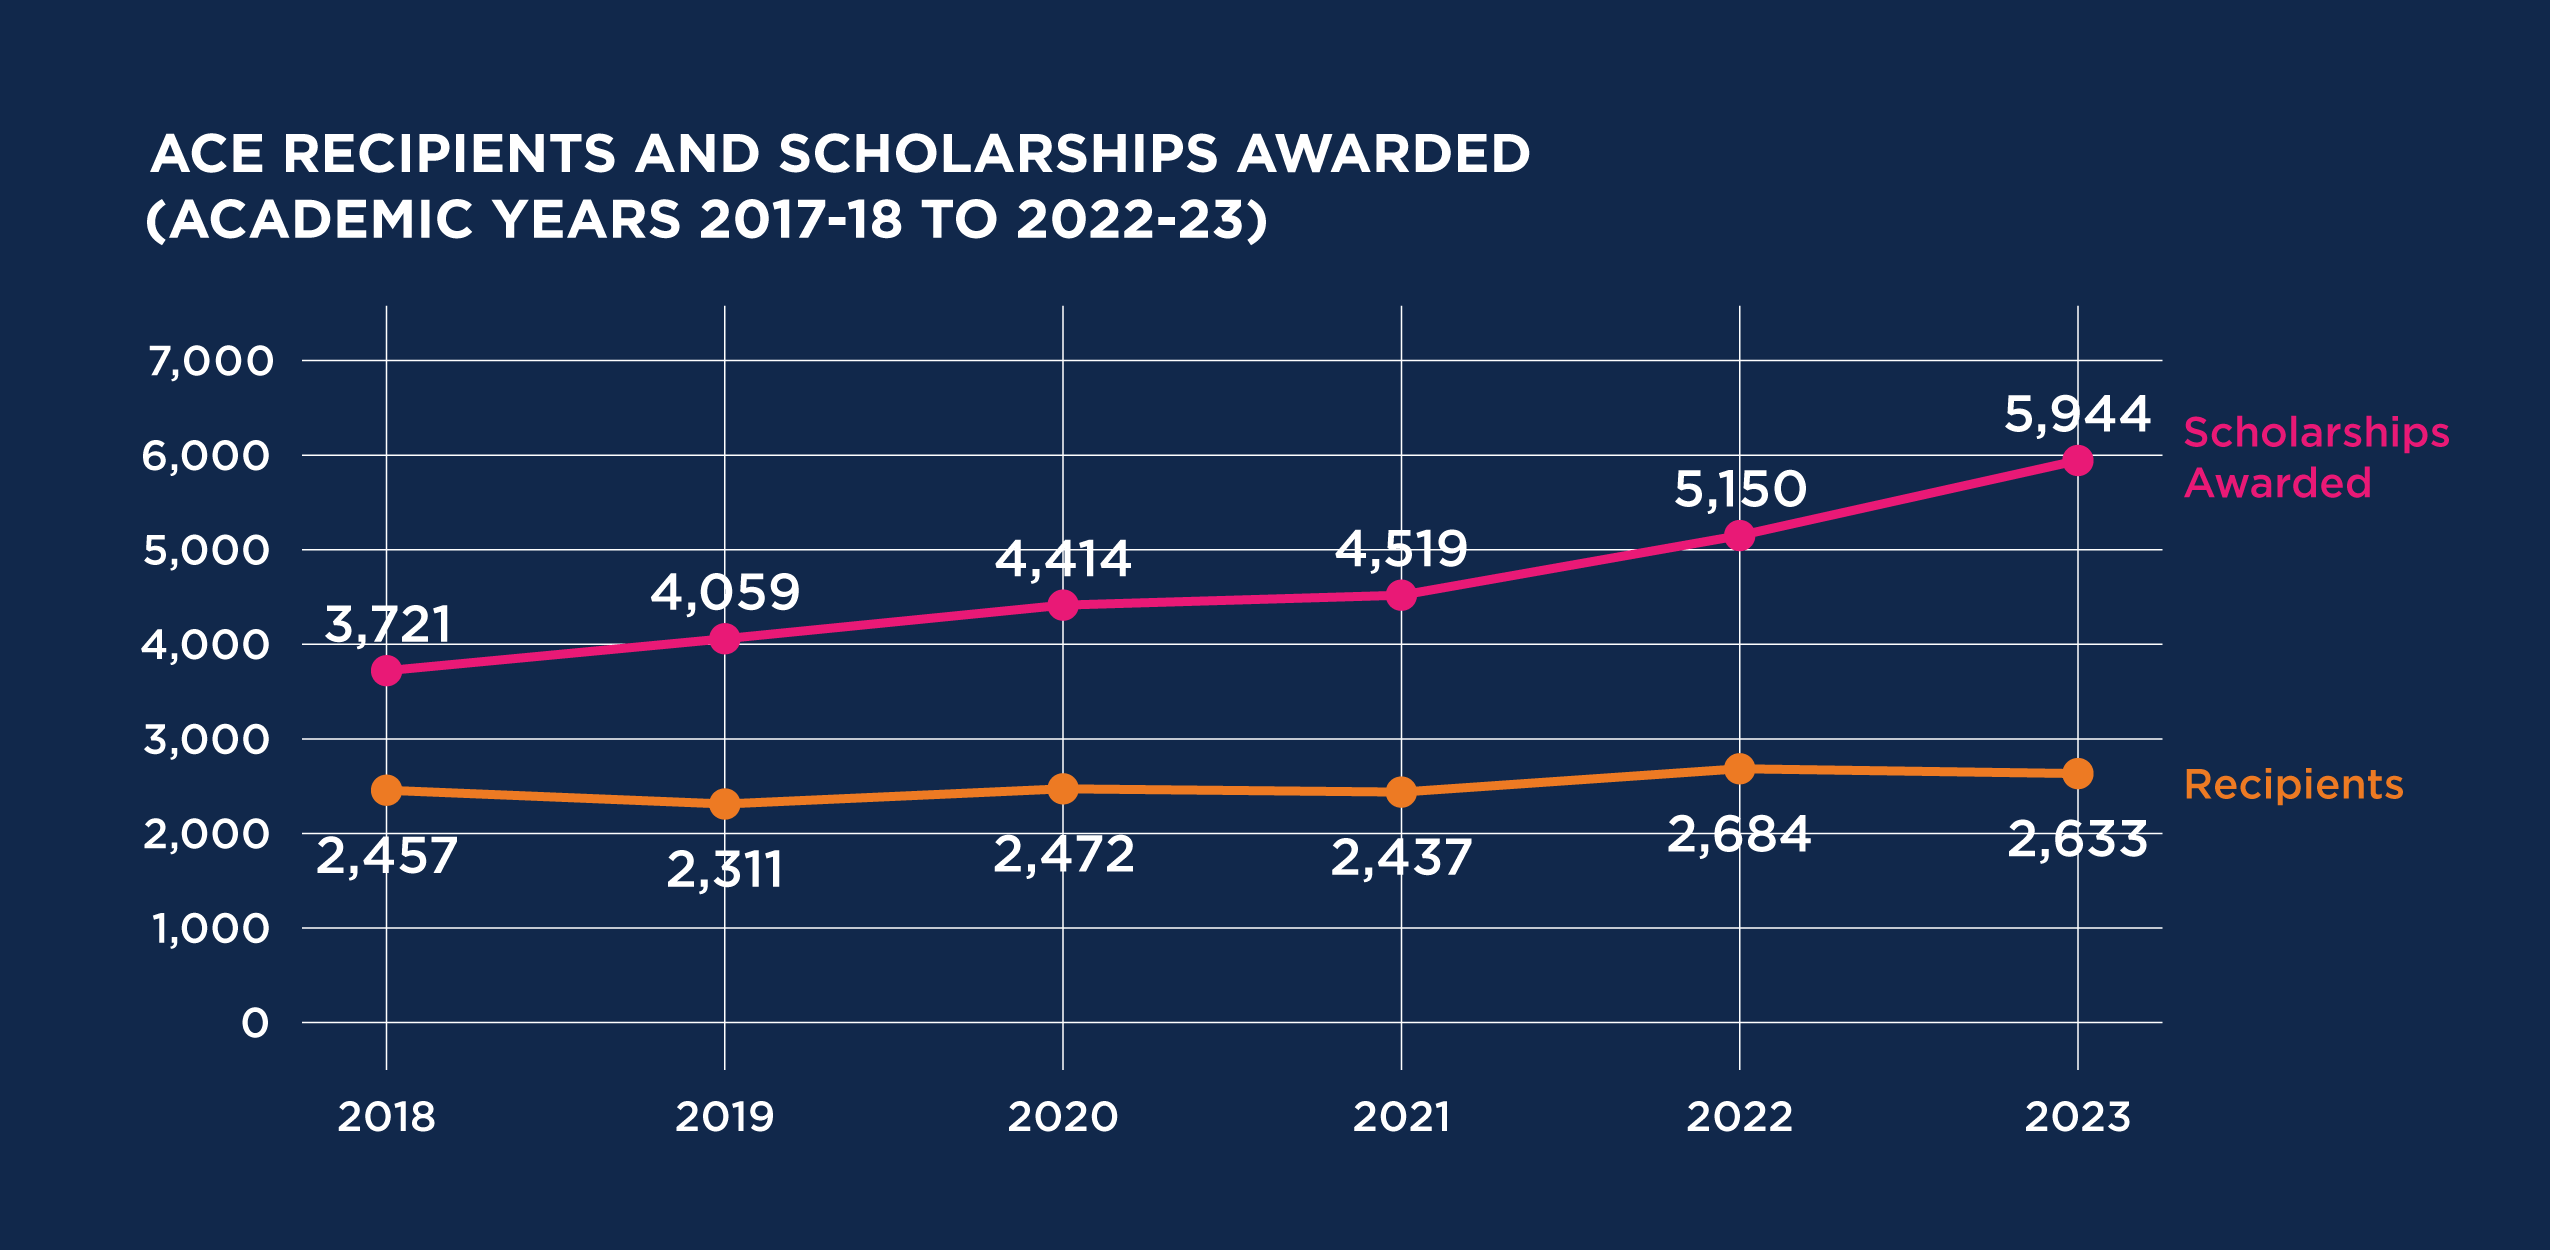
The number of Nebraska ACE scholarships awarded has increased steadily over time, while the number of ACE scholarship recipients has remained relatively constant. Read the full report on ACE scholars here: https://insights.nswers.org/evaluations/ace-2025/.
2025 Chronic Absenteeism College Going
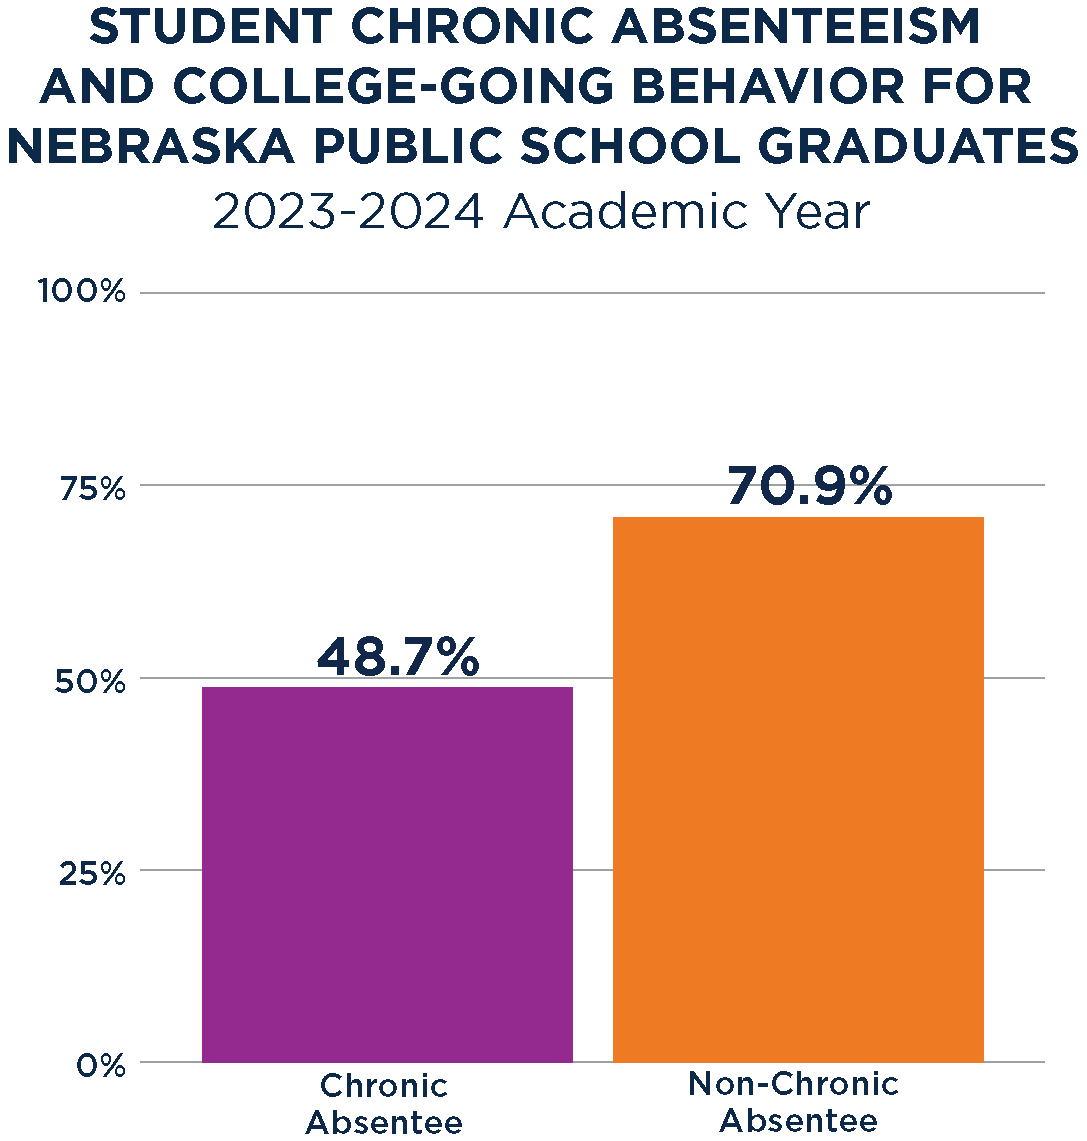
A gap in college going exists between chronic absentees & their peers, where 70.9% of graduates who regularly attend school enroll in a postsecondary institution compared to 48.7% of chronically-absent peers. To learn more, visit:...
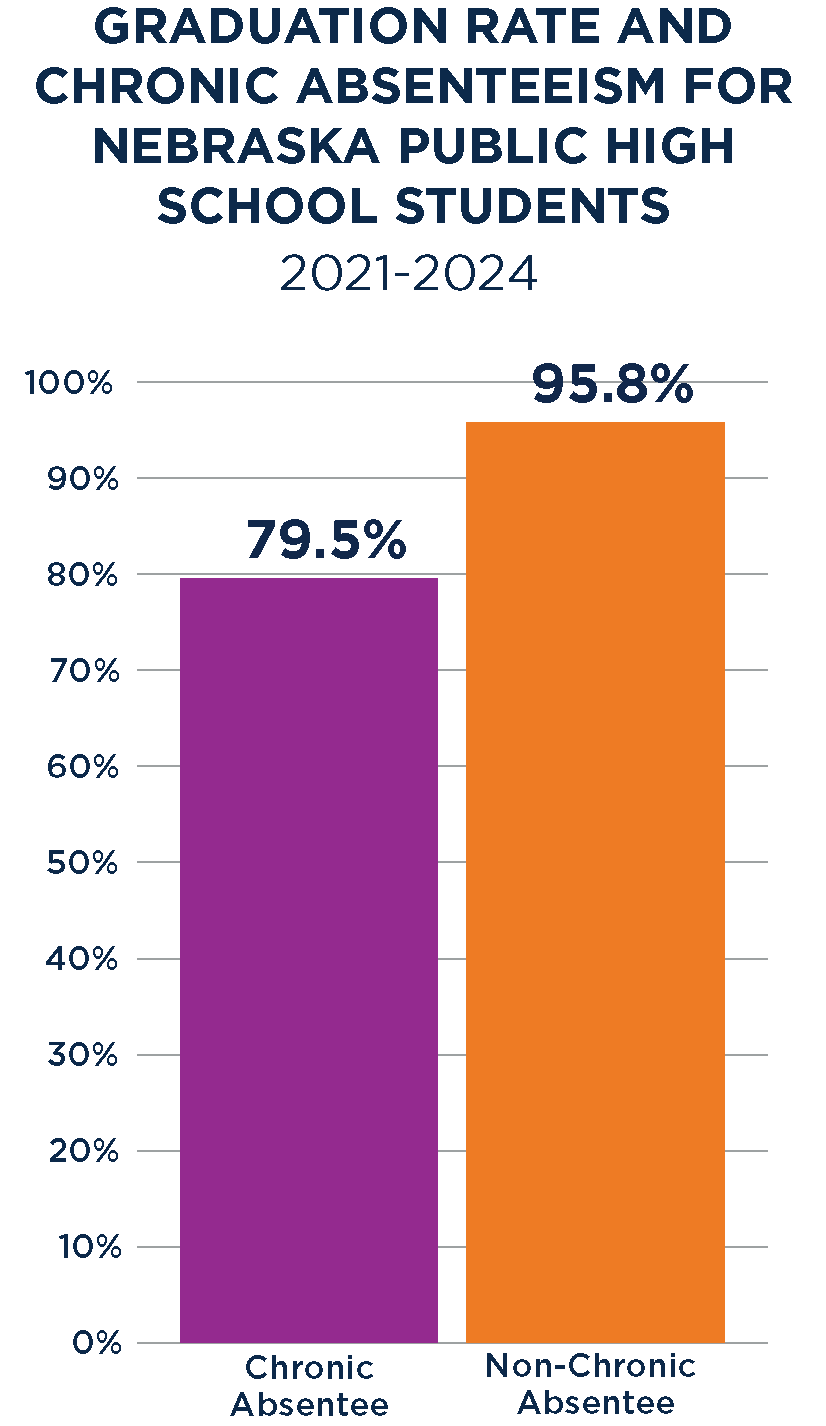
2025 Chronic Absenteeism High School Graduation
Nebraska public high school seniors who are chronically absent graduate at rates 16.3 percentage points lower than their peers who are not chronically absent. For more information on chronic absenteeism in Nebraska, visit:...
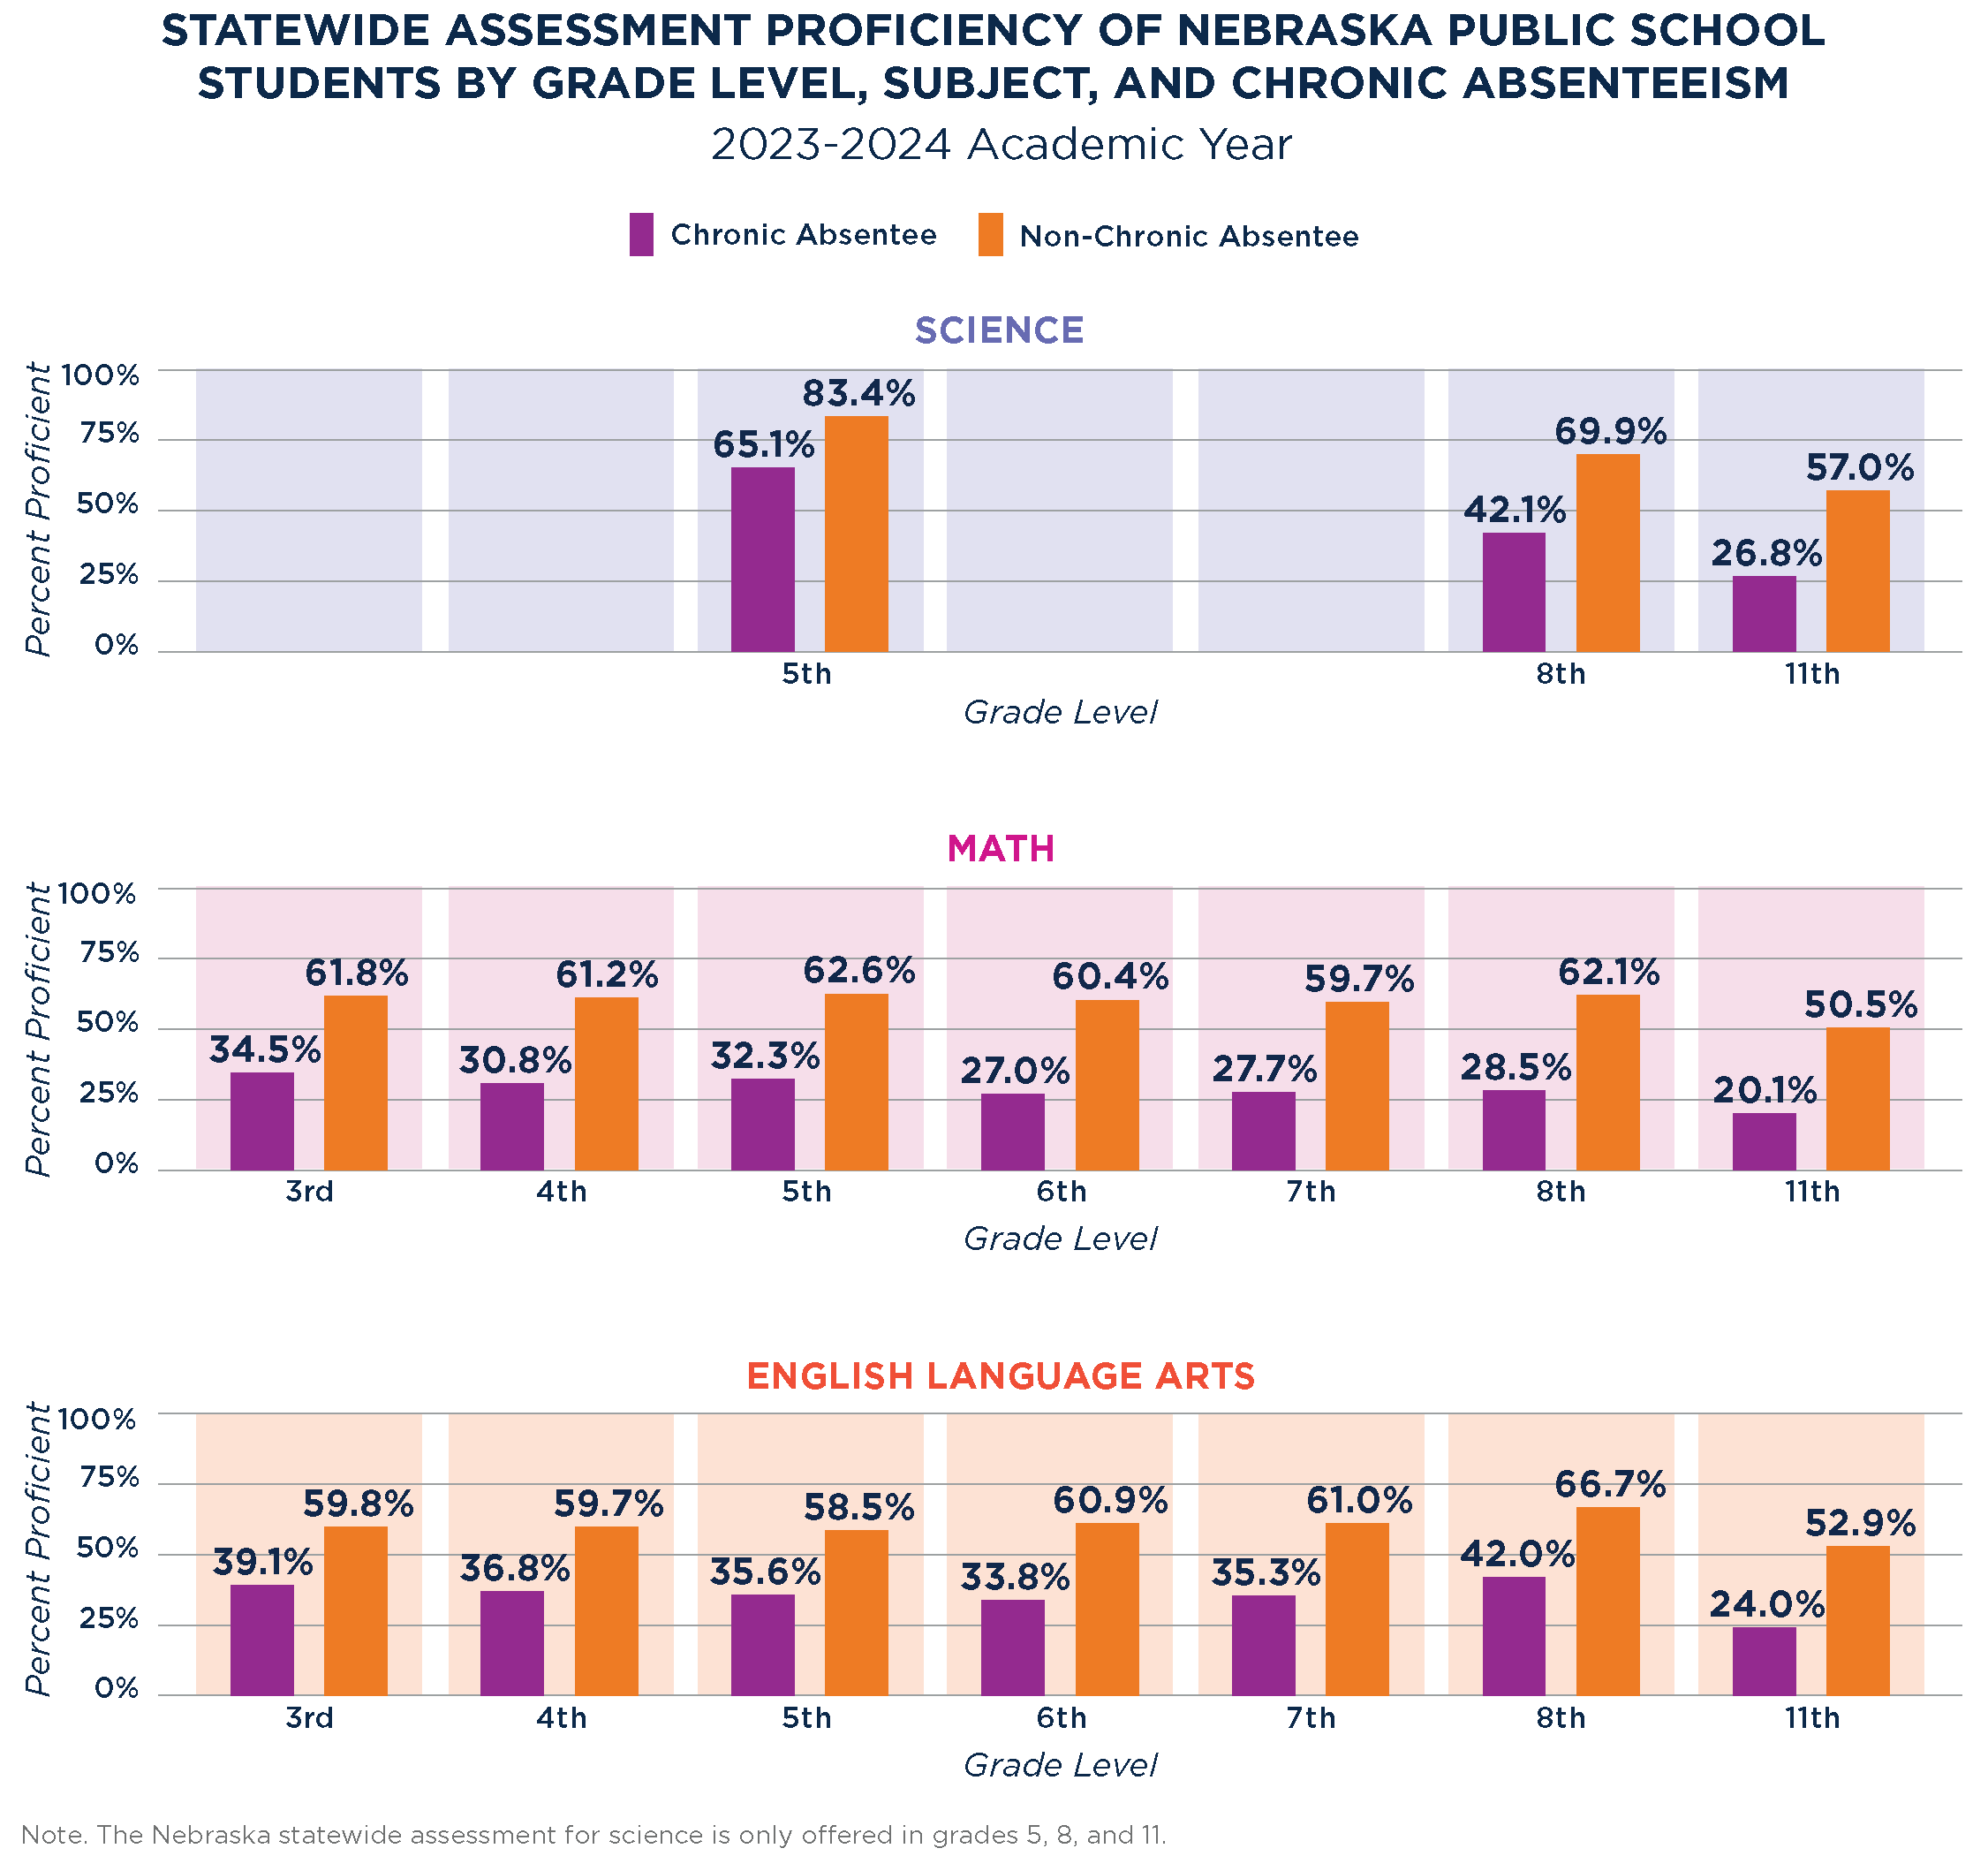
2025 Chronic Absenteeism Statewide Assessments
Divides in Nebraska statewide assessment proficiencies for science, math & English prevail between chronically-absent students and their non-chronic absentee peers. See more: https://insights.nswers.org/briefs/2025-chronic-absenteeism-brief/.

2025 Chronic Absenteeism Student Characteristics
While differences in chronic absences between student genders are minimal in Nebraska, disparities exist among student race/ethnicity and other student characteristics. To learn more about chronic absenteeism in Nebraska, visit:...

2025 Chronic Absenteeism Rate
The percentage of students who were chronically absent steeply increased during the COVID-19 pandemic & leveled off in 2024, maintaining an average chronic absenteeism rate above 20% across Nebraska public school students. Learn more:...
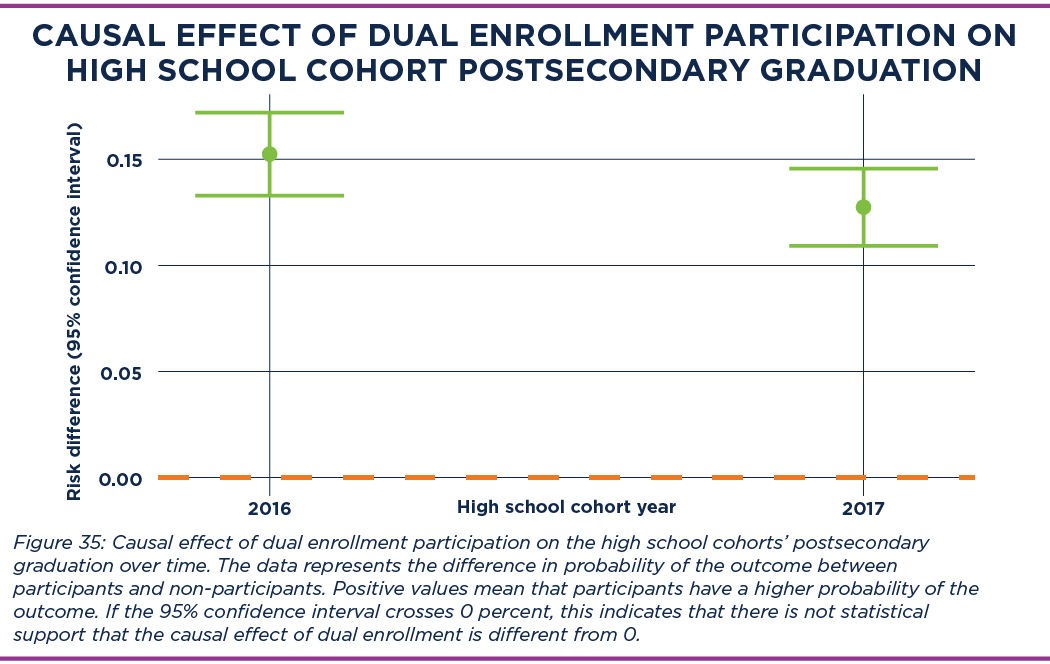
Causal Effect of Dual Enrollment Participation on Postsecondary Graduation 2025
Dual enrollment participants in Nebraska are 13 percentage points more likely to attain a postsecondary degree within six years of high school graduation than those who do not participate. Read more about dual enrollment in Nebraska:...
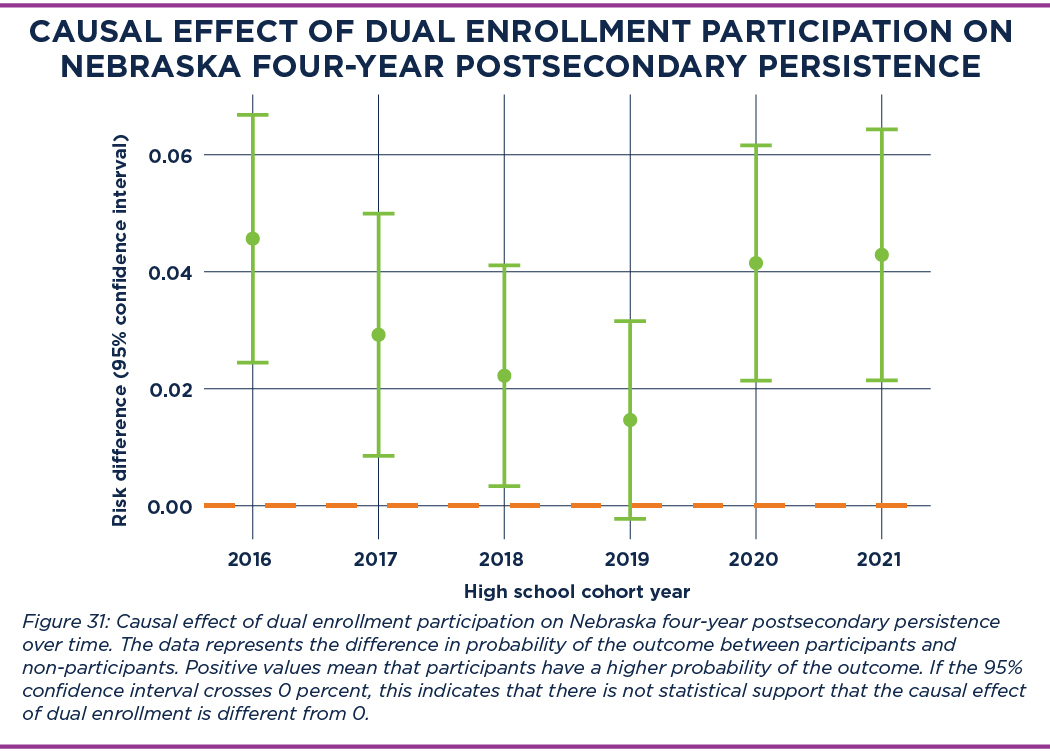
Causal Effect of Dual Enrollment Participation on Nebraska Four-year Postsecondary Persistence 2025
At four-year Nebraska-based institutions, college persistence rates were four percentage points higher for those who participated in dual enrollment than those who did not. Learn more about dual enrollment in Nebraska:...
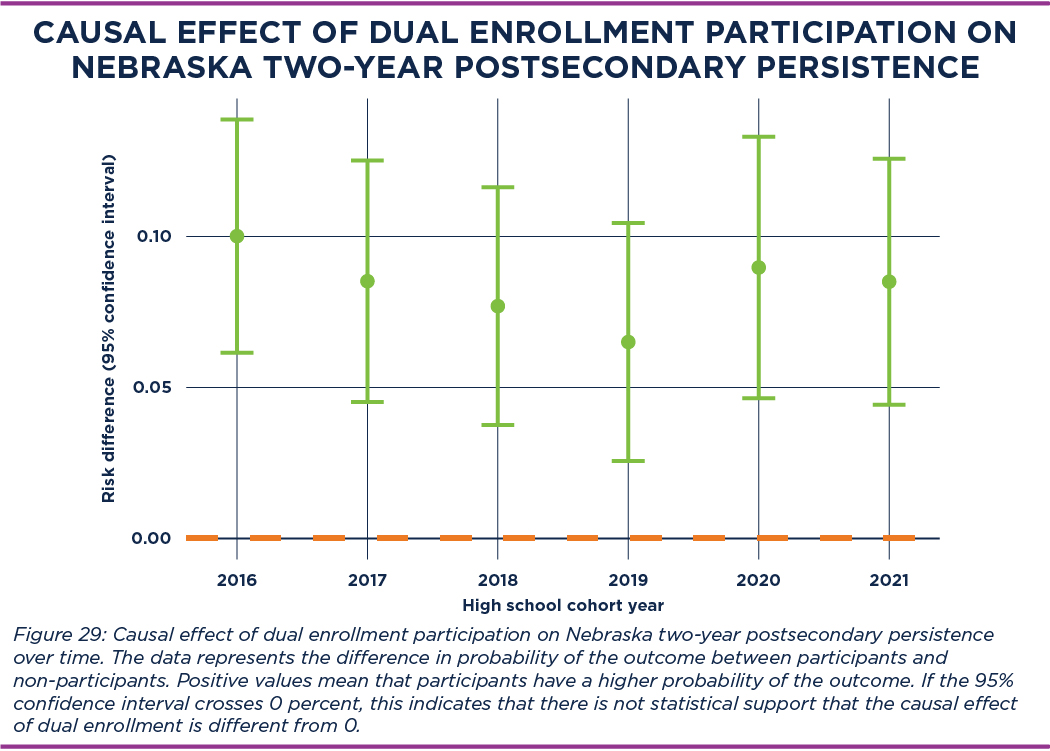
Causal Effect of Dual Enrollment Participation on Nebraska Two-Year Postsecondary Persistence 2025
College persistence rates are greater at Nebraska-based institutions for those who participated in dual enrollment than those who did not. In fact, 9 percentage points higher at two-year colleges! Read more:...
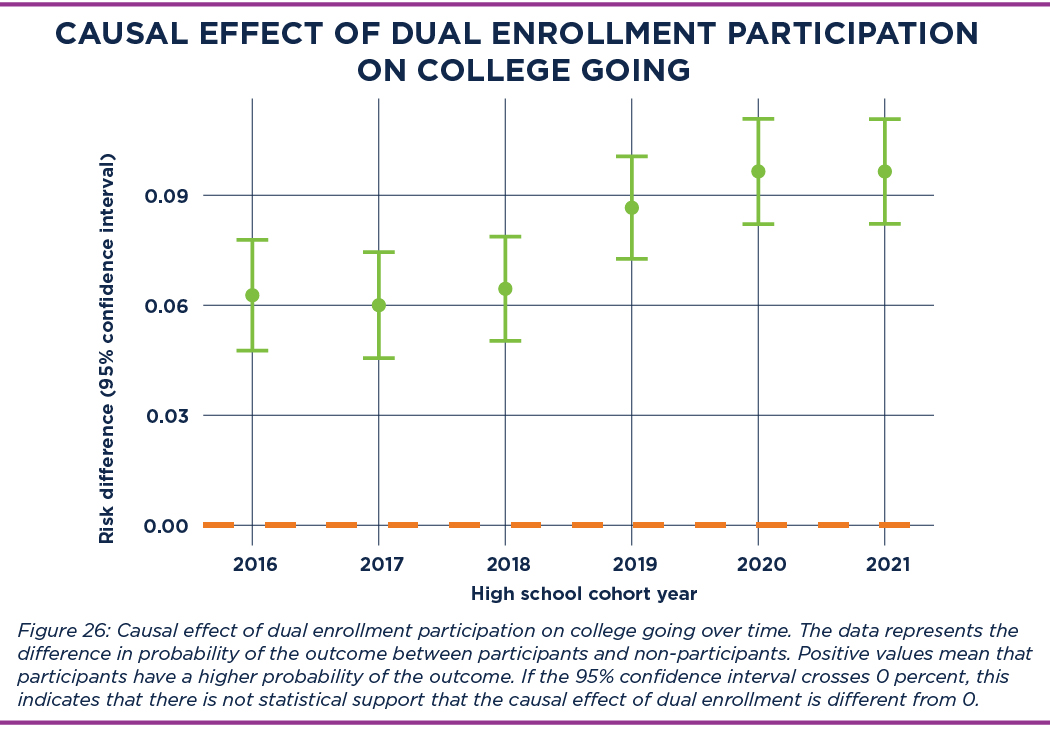
Causal Effect of Dual Enrollment Participation on College Going 2025
Nebraska dual enrollment participants are 10 percentage points more likely to enroll in college within 16 months of high school graduation than those who do not participate. Read more about dual enrollment in Nebraska:...
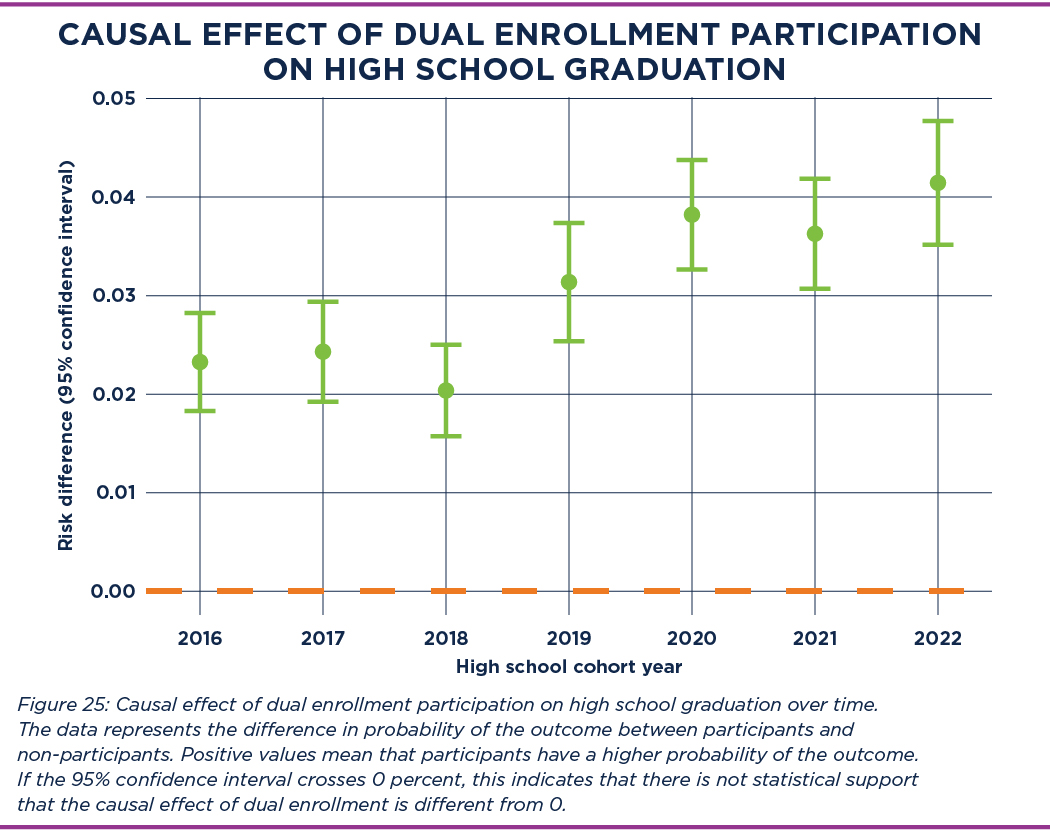
Causal Effect of Dual Enrollment Participation on High School Graduation 2025
Dual enrollment participants in Nebraska are four percentage points more likely to graduate high school on time than non-participants. Read more about dual enrollment in Nebraska: https://insights.nswers.org/special-report/2025-dual-enrollment.pdf.
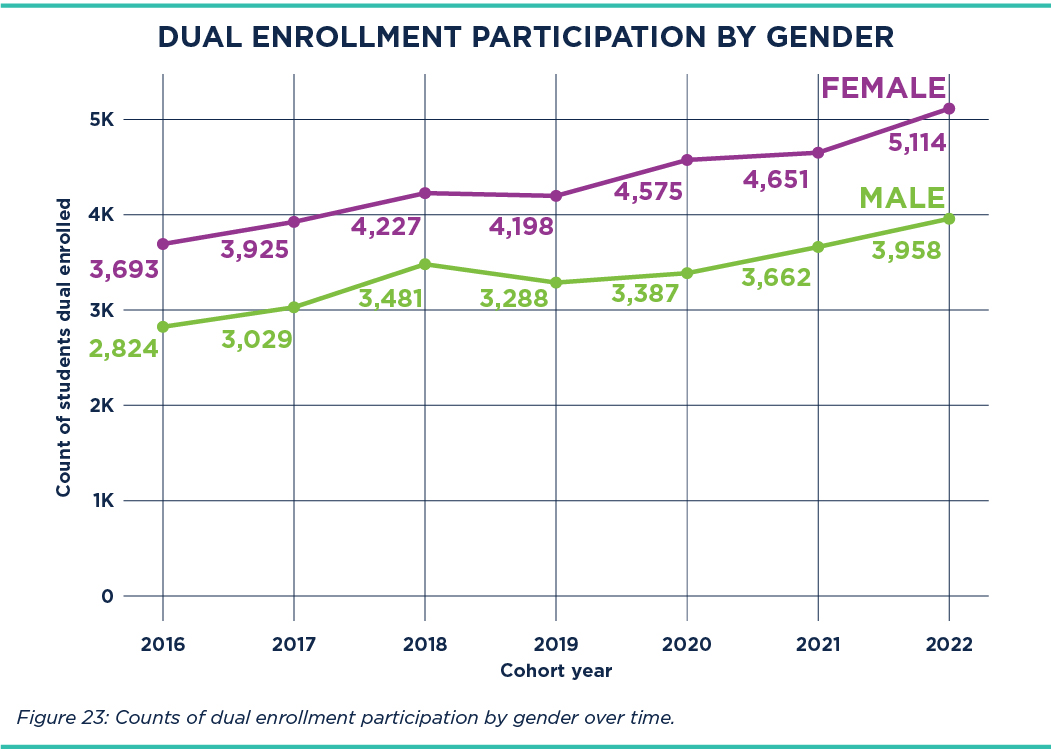
Dual Enrollment Participation by Gender 2025
Female students are more likely to participate in dual enrollment in Nebraska than male students (56% versus 44%) and this gender gap continues over time. Read more about dual enrollment in Nebraska: https://insights.nswers.org/special-report/2025-dual-enrollment.pdf.
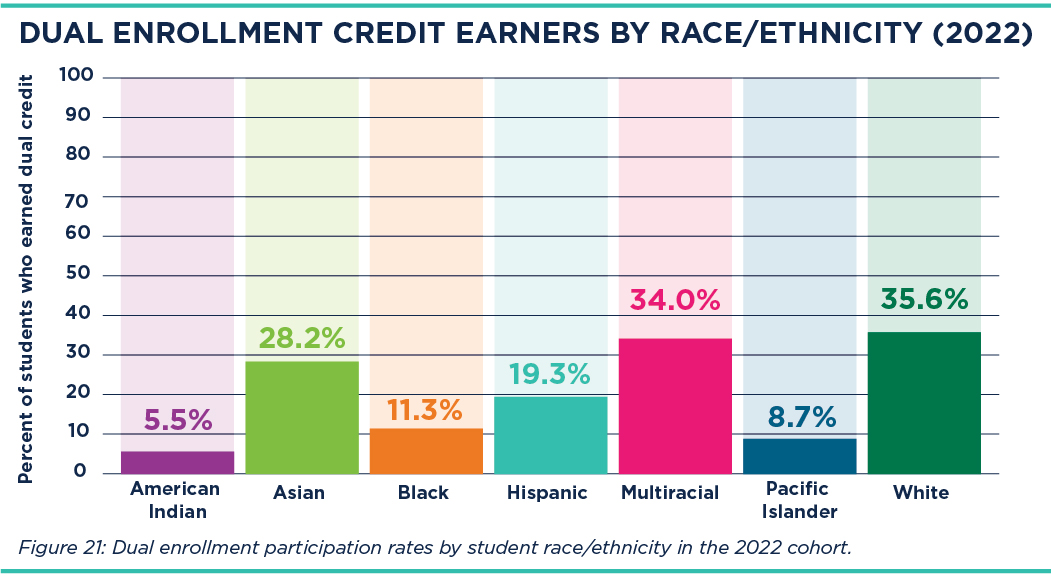
Dual Enrollment Credit Earners by Race/Ethnicity 2025
White students had the highest dual enrollment participation rate in Nebraska (over 35%), while Hispanic (19%) and Black students (11%) participated at lower rates. To learn more about dual enrollment in Nebraska, visit:...
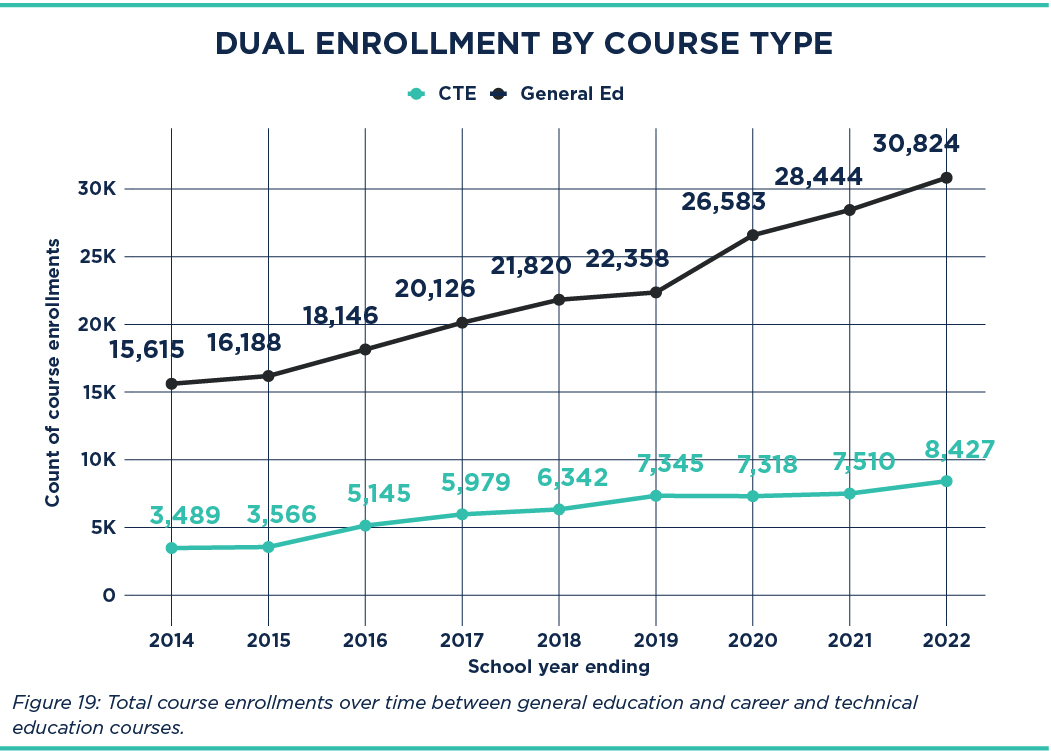
Dual Enrollment by Course Type 2025
Career and Technical Education (CTE) courses make up 22% of the total courses taken by Nebraska dual enrollment participants in the 2022 cohort. Both general education & CTE courses have increased over time. Read more:...
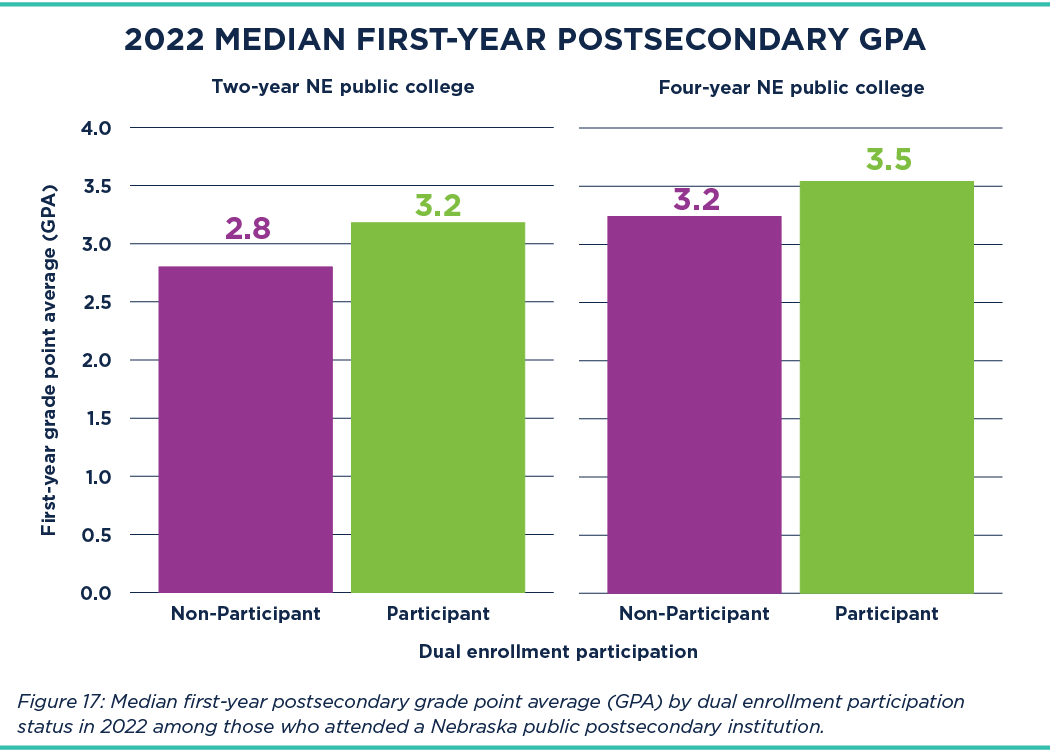
Median First Year Postsecondary GPA Dual Enrollment 2025
First-year postsecondary college GPAs are higher among dual enrollment participants than non-participants at both two- and four-year Nebraska colleges. Read more about dual enrollment in Nebraska: https://insights.nswers.org/special-report/2025-dual-enrollment.pdf.
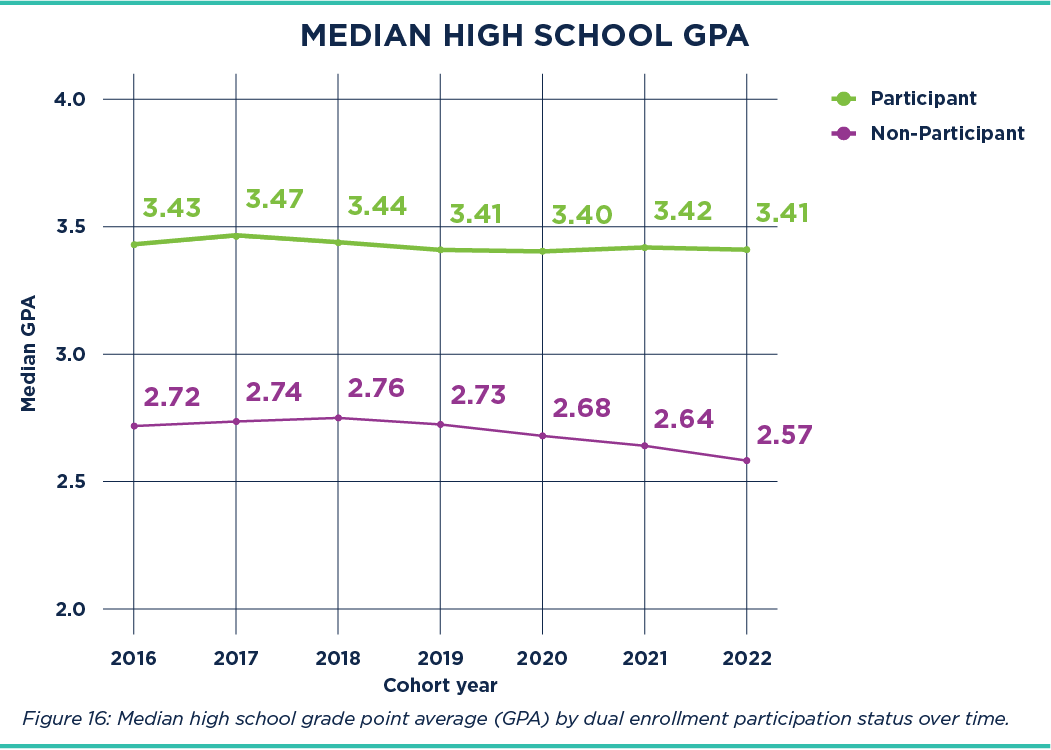
Dual Enrollment Median High School GPA 2025
The median high school GPA among Nebraska dual enrollment participants is 3.41, which is higher than among non-dual enrollees who earned 2.57 in the 2022 cohort. Read more about dual enrollment in Nebraska:...
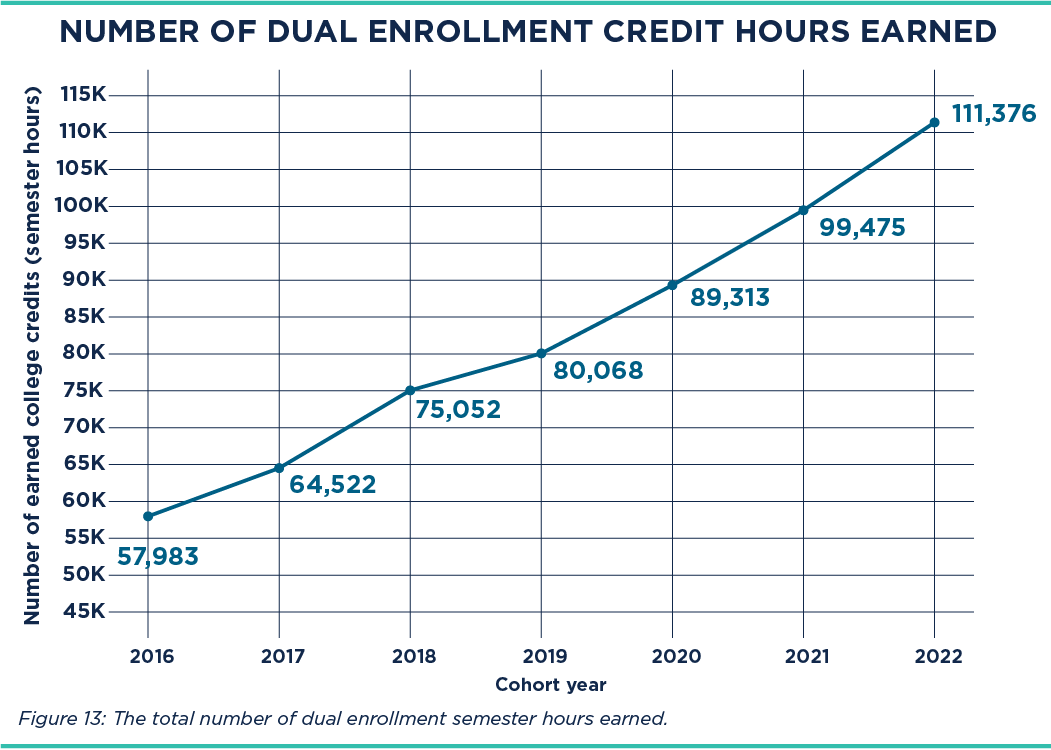
2025 Dual Enrollment Credit Hours Earned
The total number of college credit hours earned by dual enrollment participants in Nebraska has climbed over time, with over 111k earned college credits in the 2022 cohort. For more on dual enrollment in Nebraska, visit:...
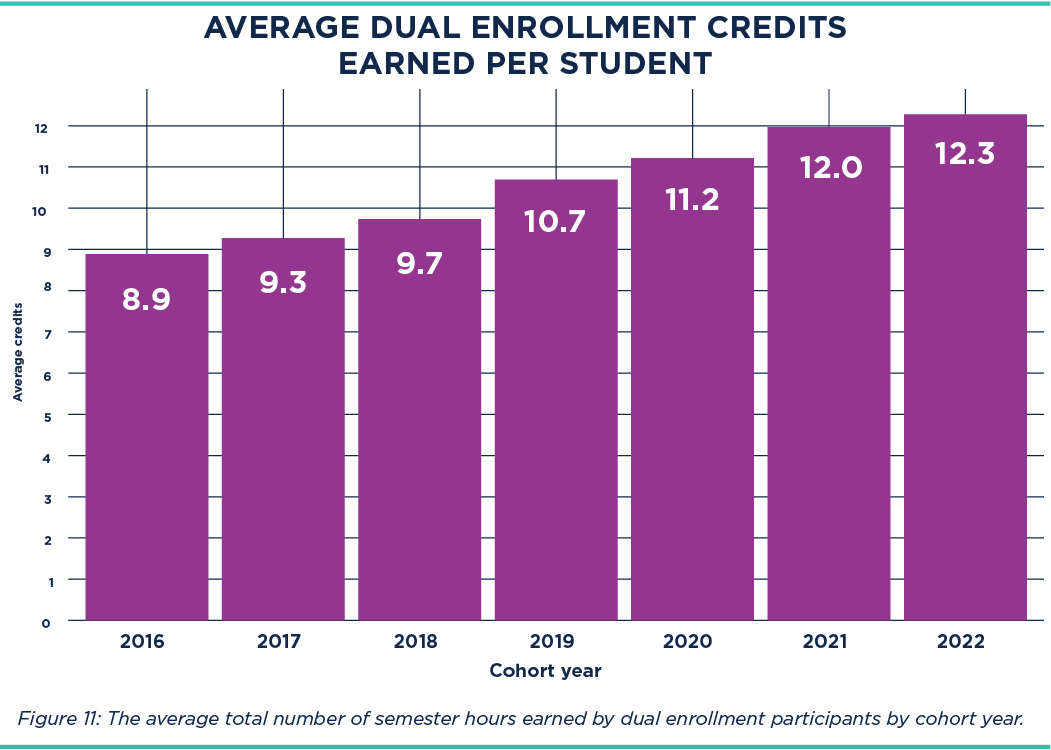
Average Dual Enrollment Credits Earned Per Student 2025
On average, Nebraska dual enrollment participants in the 2022 cohort earned 12.3 semester hours while in high school, equivalent to one full-time semester of college. This marks an increase from 8.9 semester hours in the 2016 cohort. Read more:...
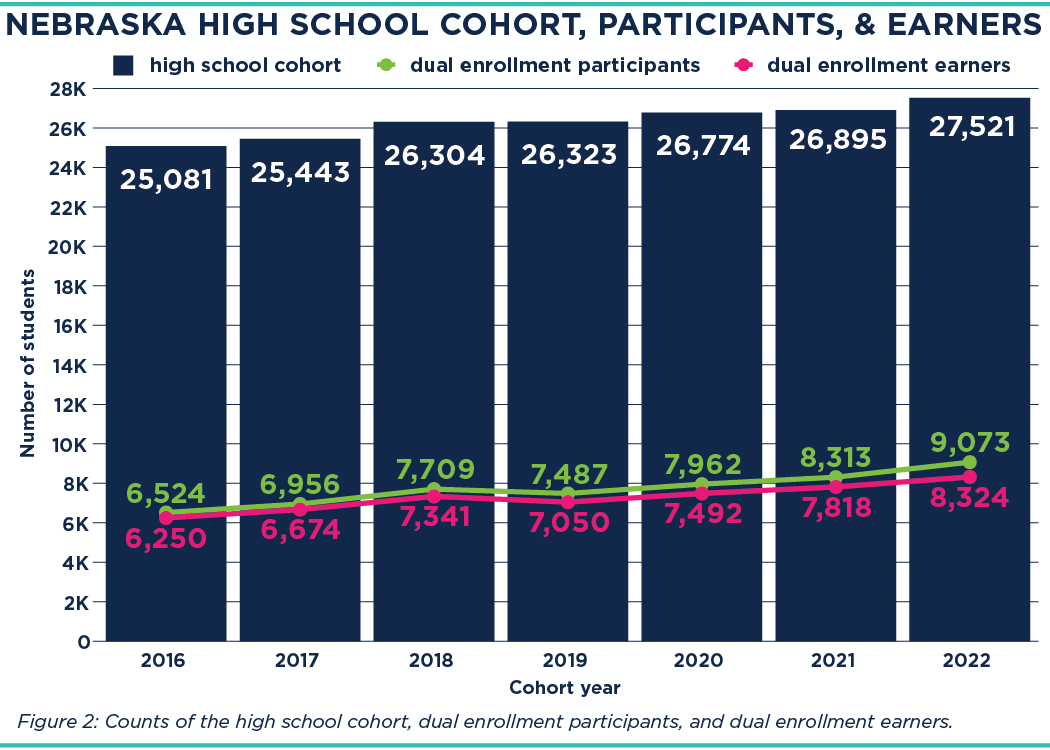
Nebraska High School Cohort, Participants, & Earners
Dual enrollment participation in Nebraska has increased significantly over time. In the 2022 cohort, 33% of students participated, up from 26% in the 2016 cohort. Read more about dual enrollment in Nebraska:...
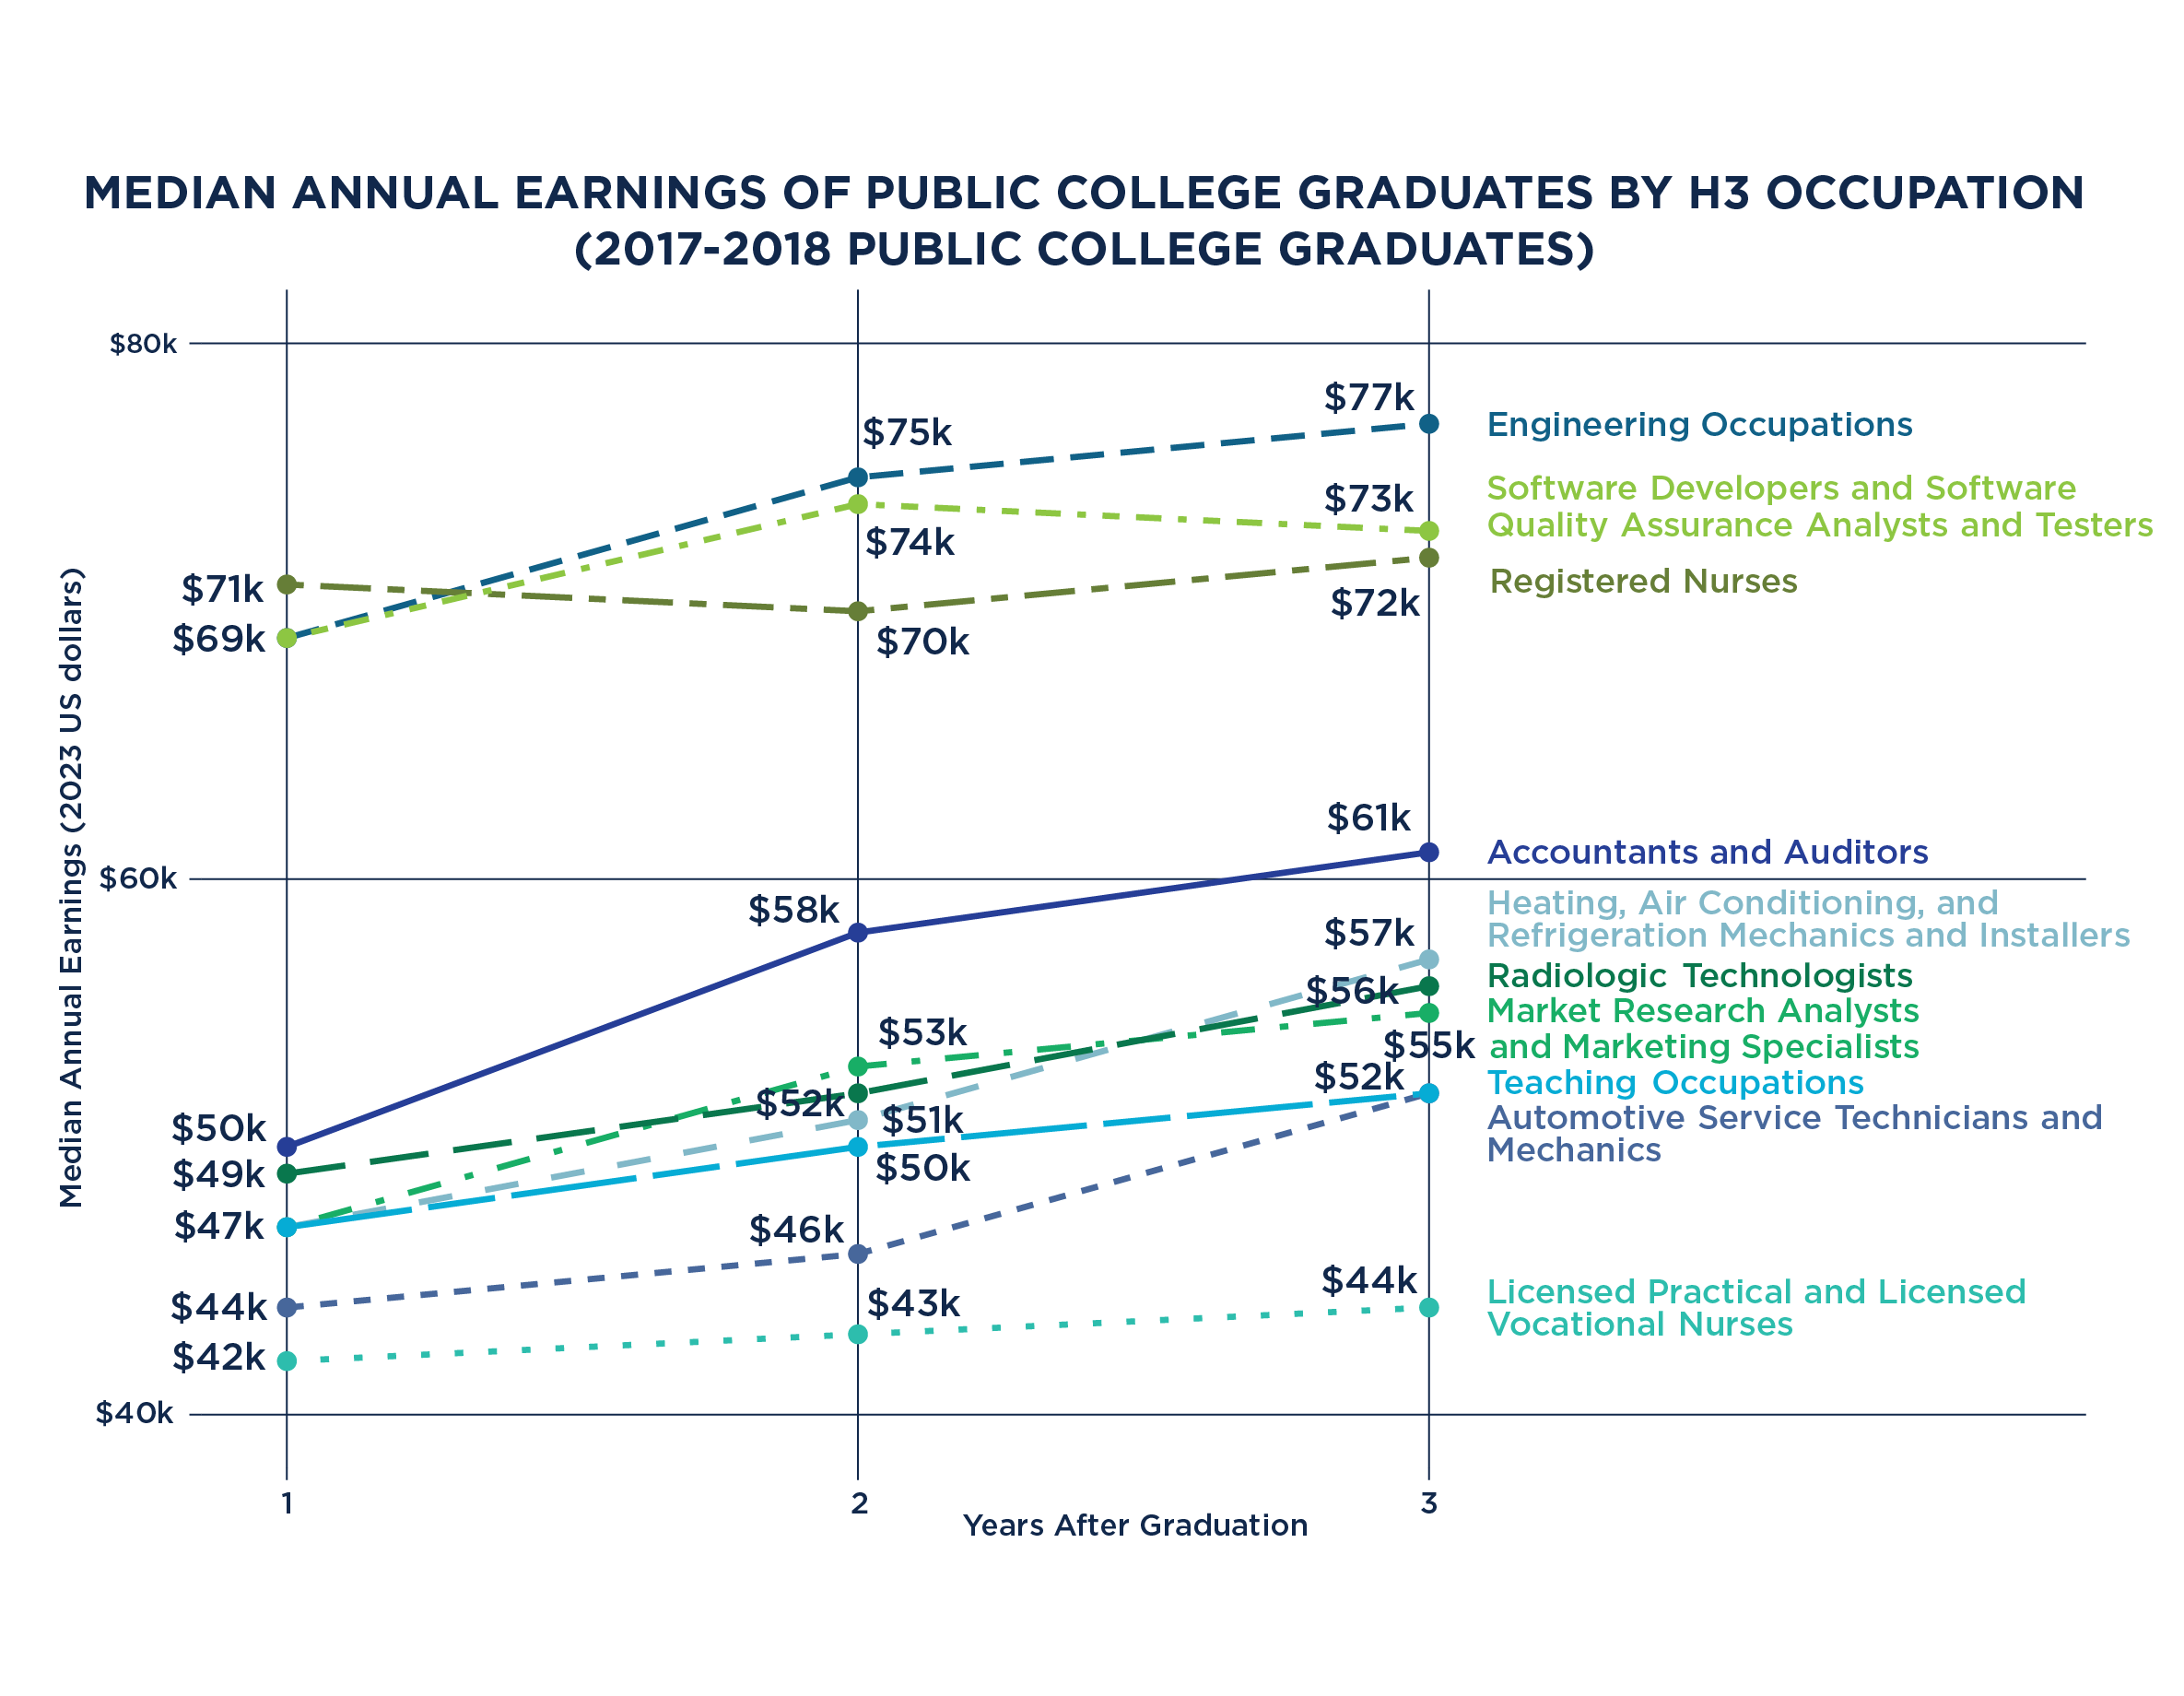
Median Annual Earnings of Public College Graduates by H3 Occupation 2017-2018
Graduates from Nebraska 4-year public college programs related to engineering; registered nurses; & software developers & quality assurance analysts make more money than graduates from other programs. Read more about earnings and the employment gap at:...
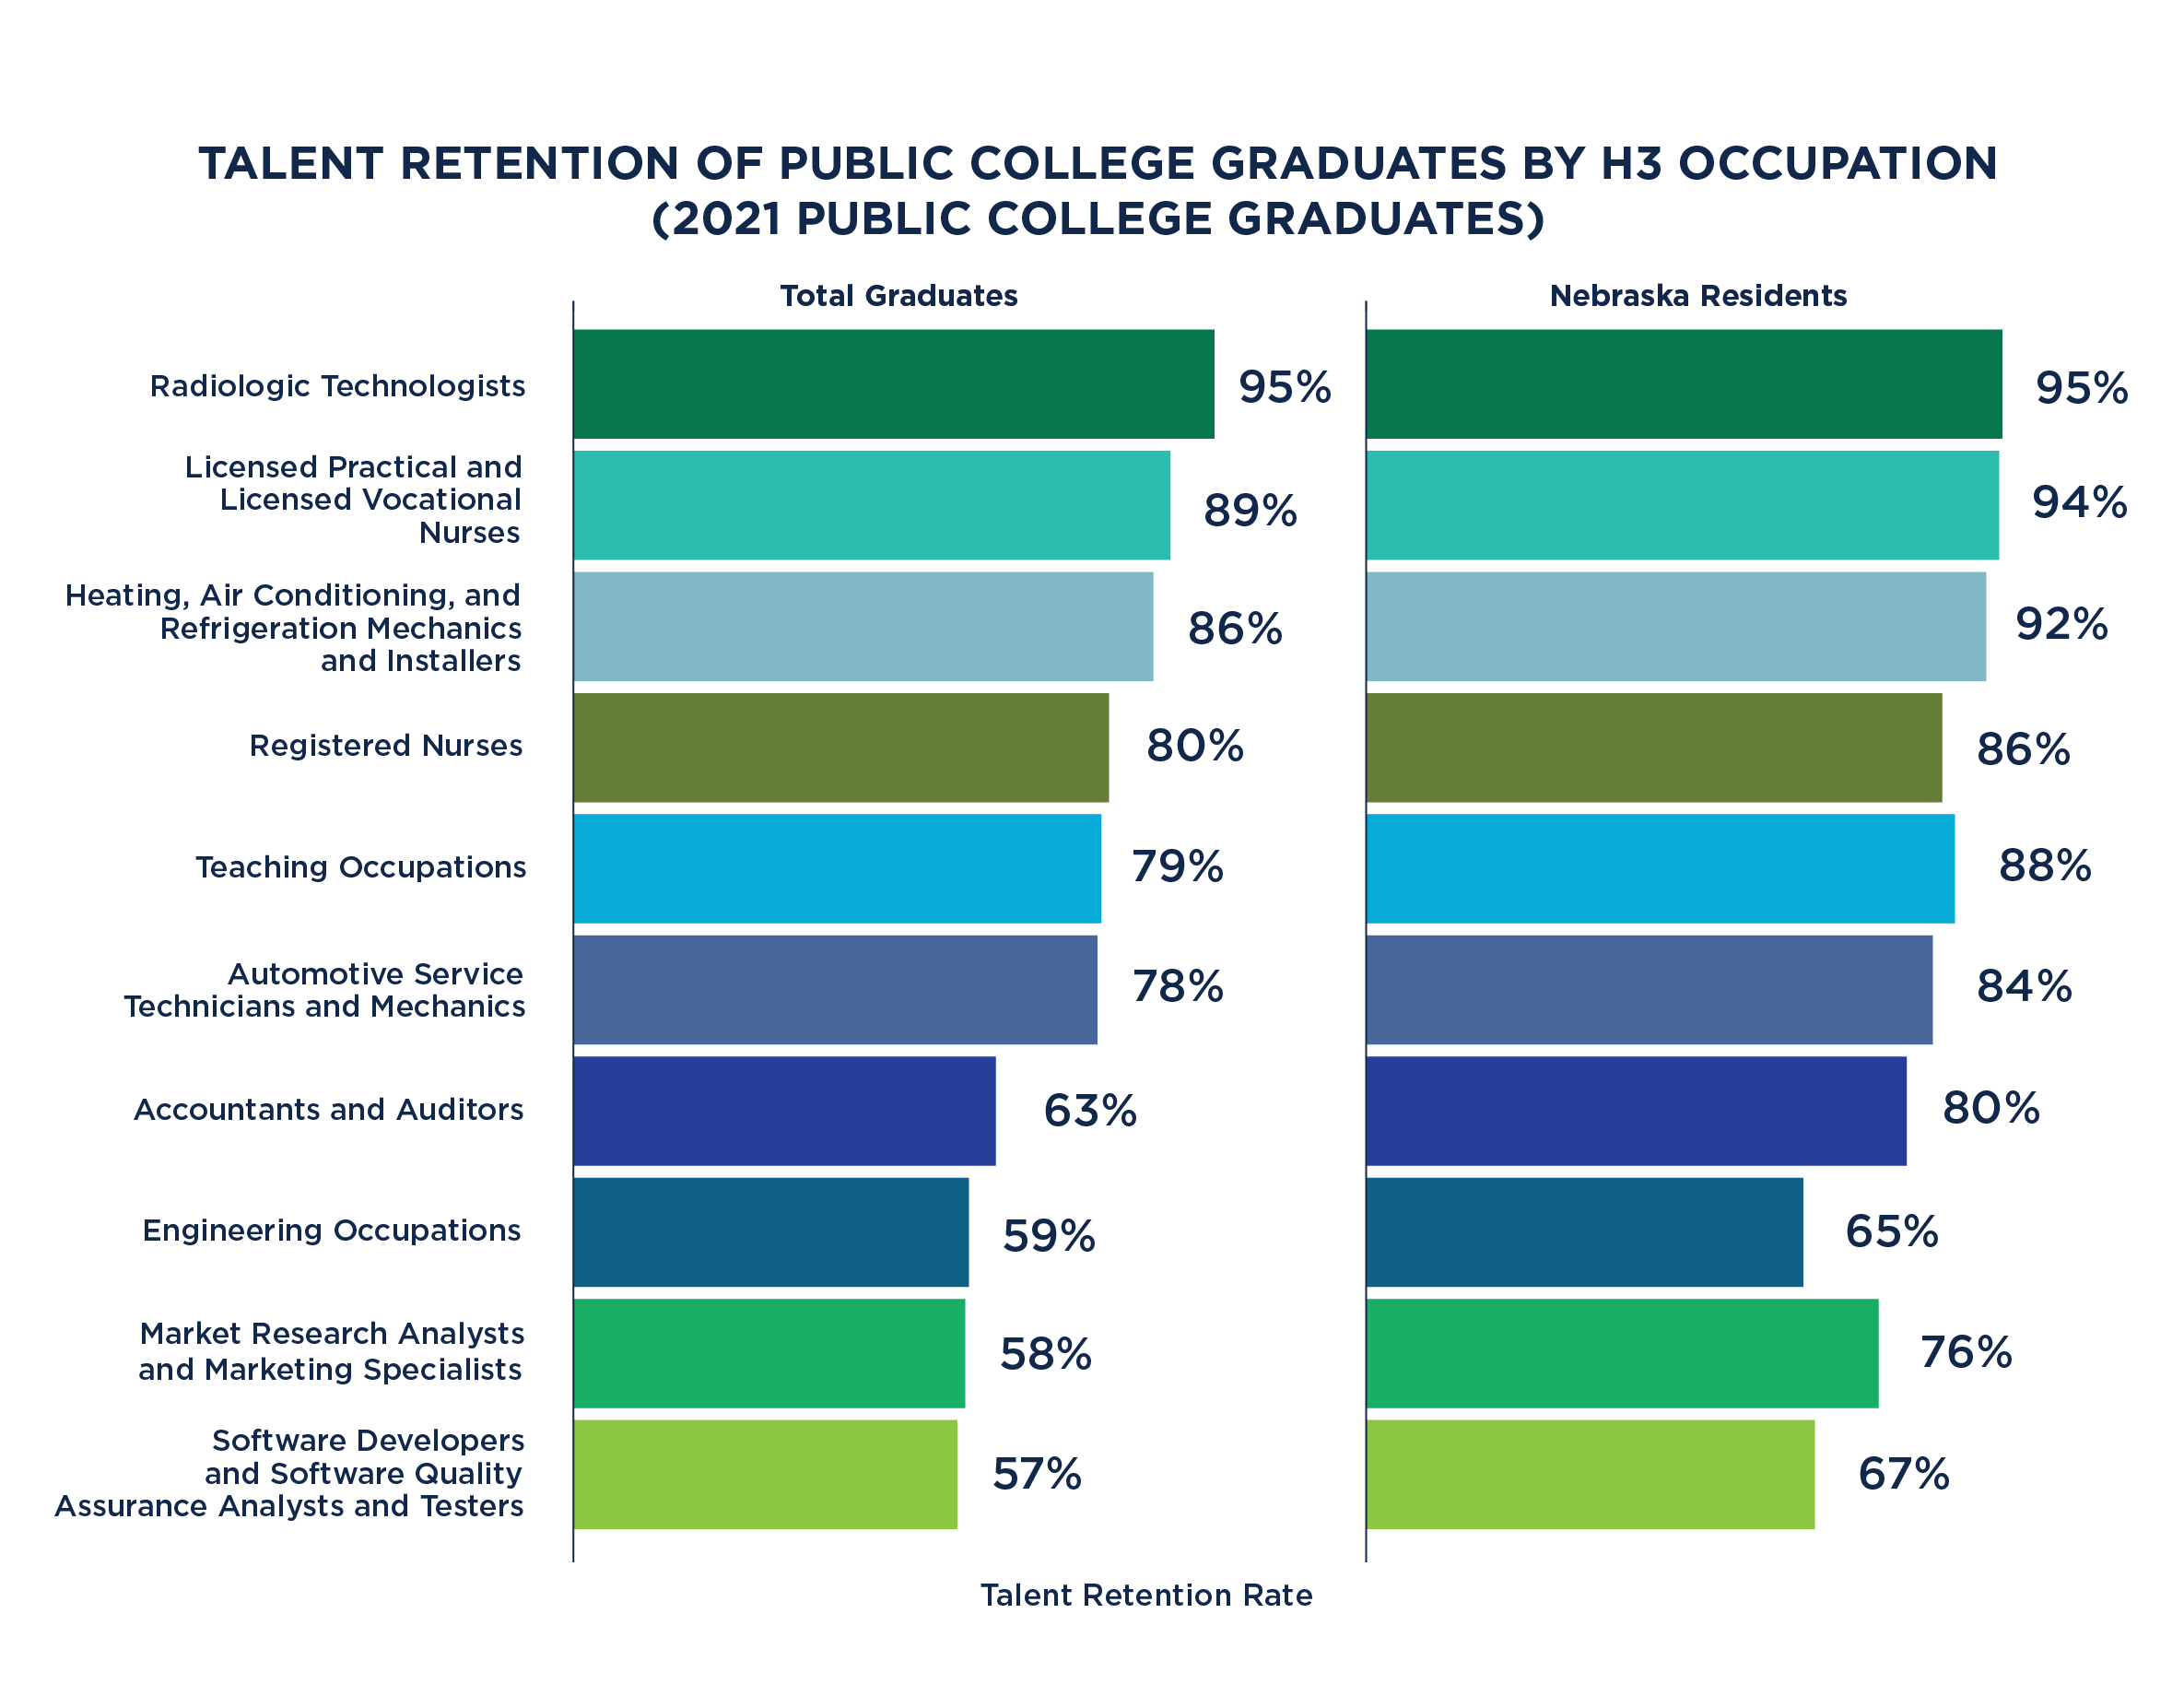
Talent Retention of Public College Graduates by H3 Occupation 2021
Nebraska public high school grads have higher talent retention rates than the total population. This suggests that increasing enrollment of Nebraska residents in the state’s colleges could retain more college-educated workers. For more information, visit:...
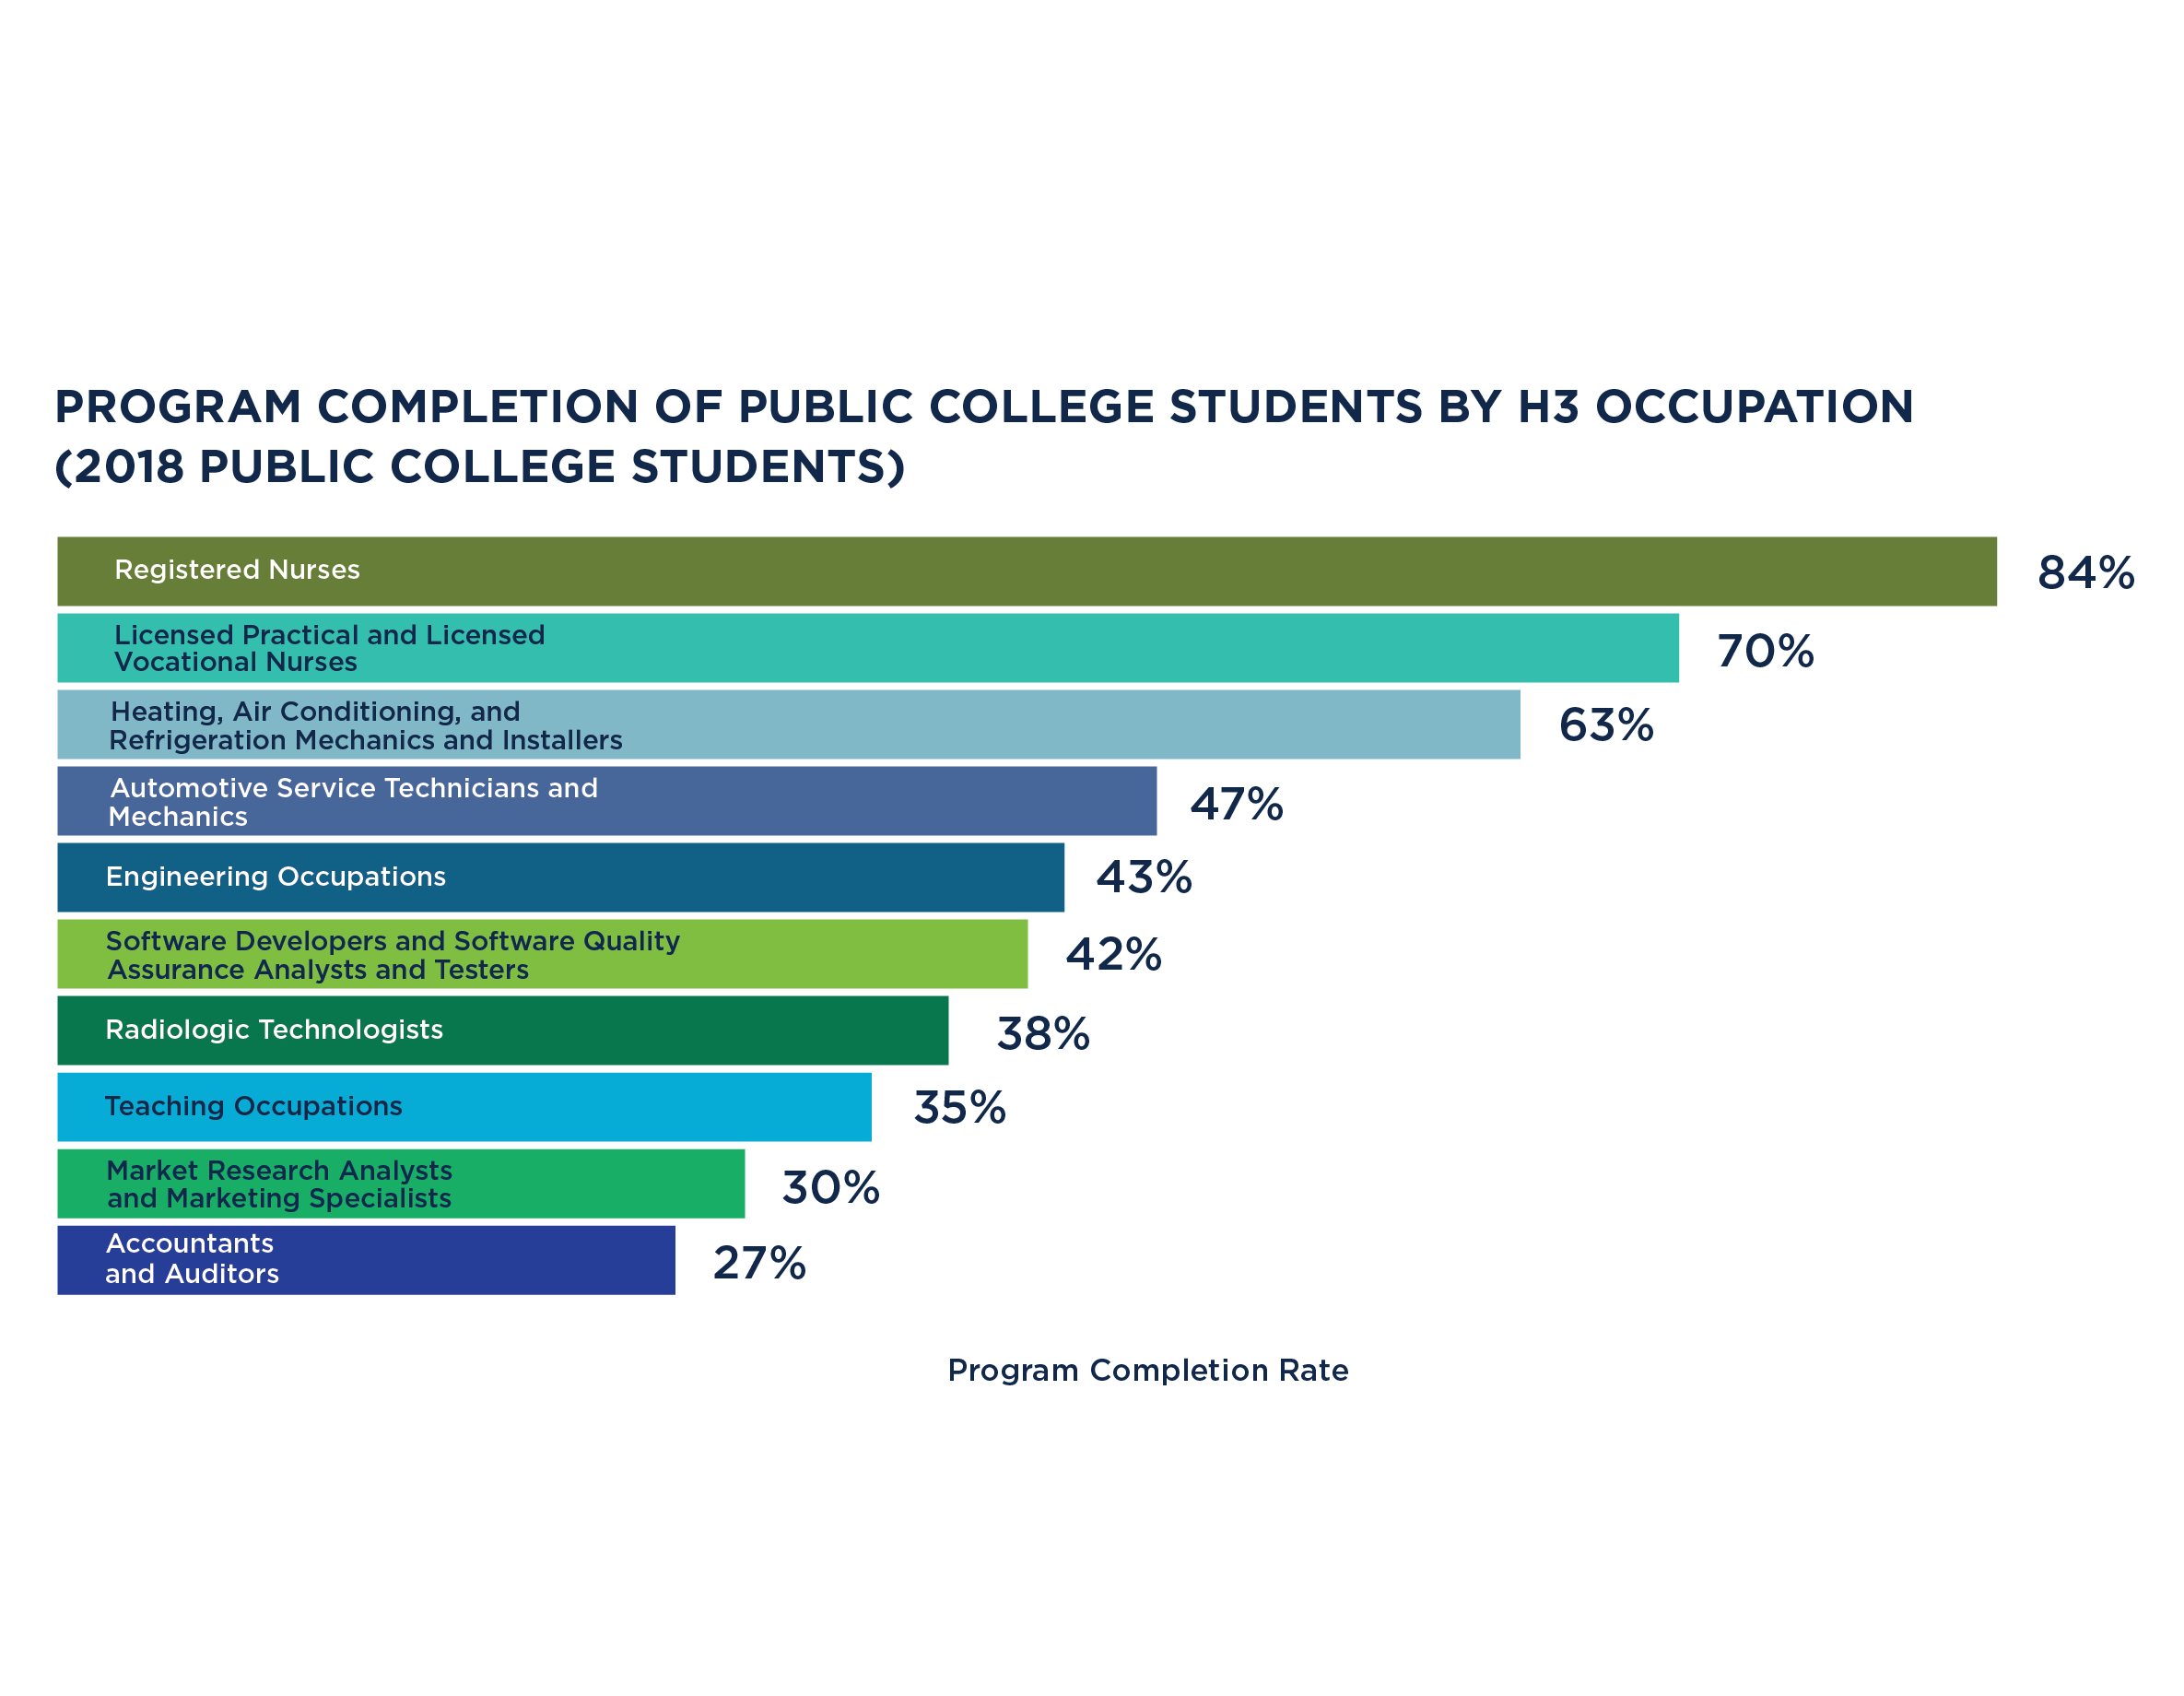
Program Completion of Public College Students By H3 Occupation 2018
Students in programs related to nursing have the highest program completion rates in Nebraska. However, public college students in other selected H3 jobs generally have low program completion rates. Read more here:...
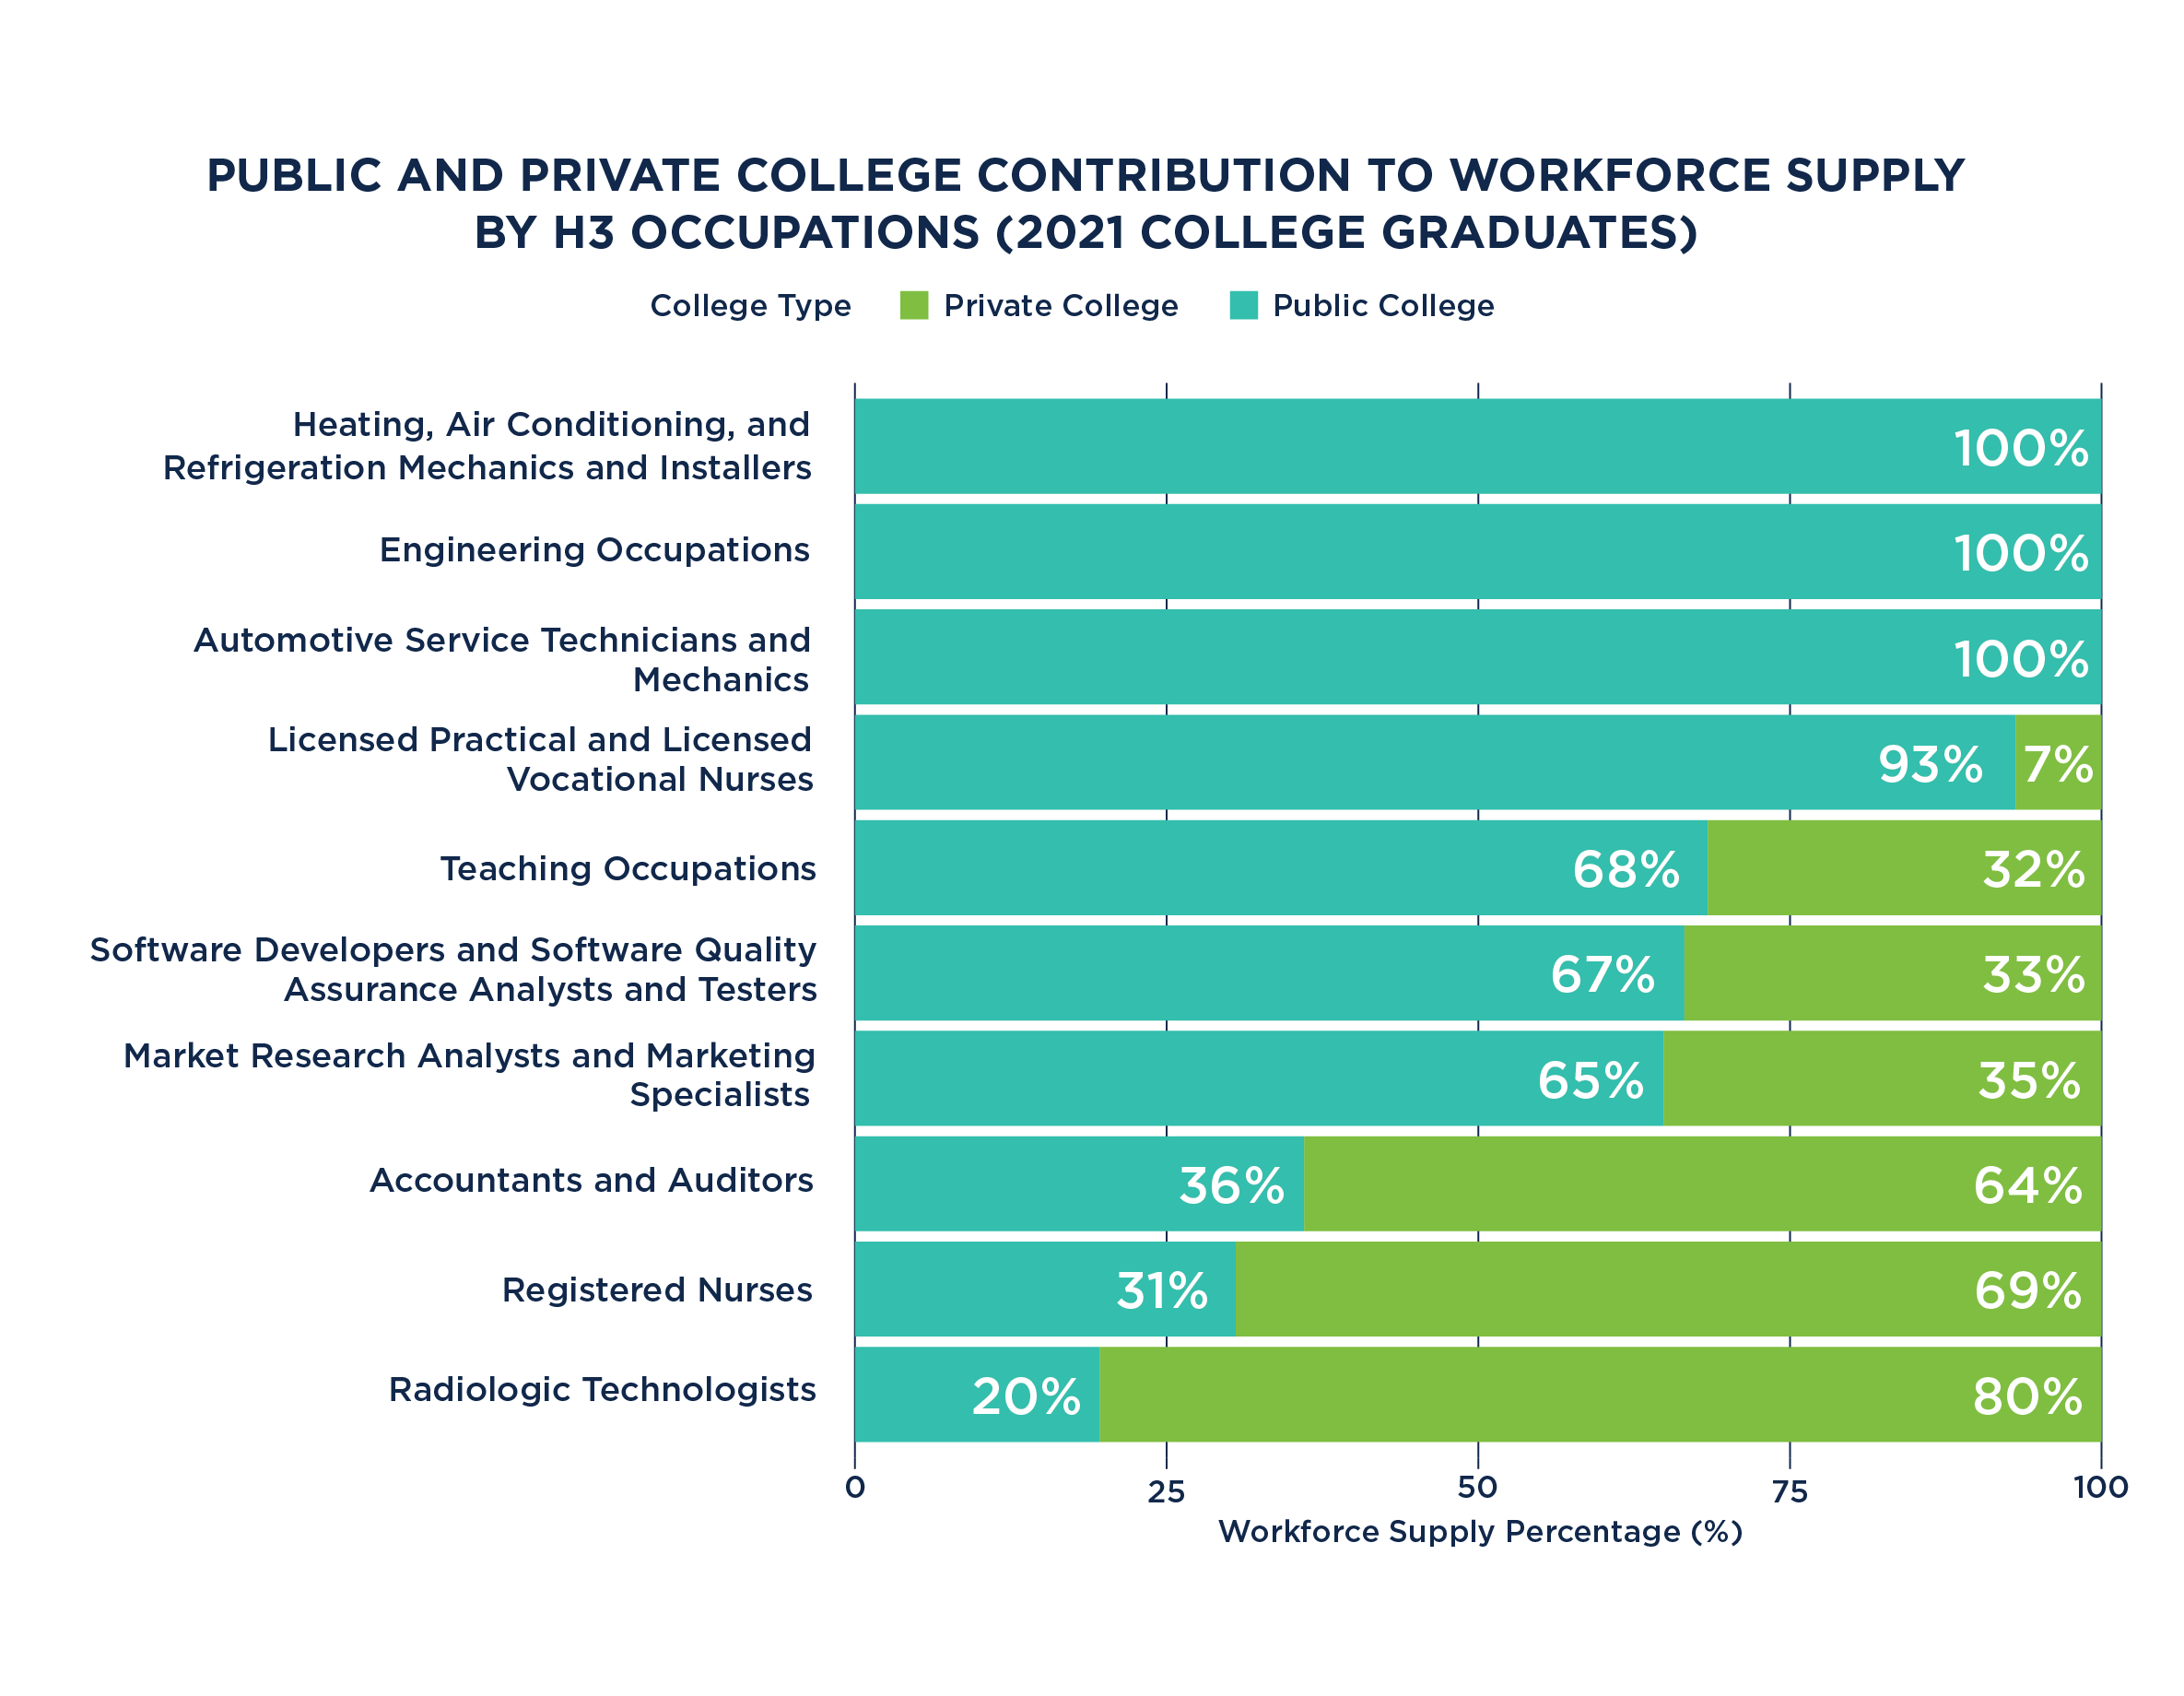
Public and Private College Contribution to Workforce by H3 2021
For most selected occupations, Nebraska public colleges contribute a higher percentage of qualified graduates to the state’s workforce than private colleges. Learn more about workforce supply and the employment gap in Nebraska:...
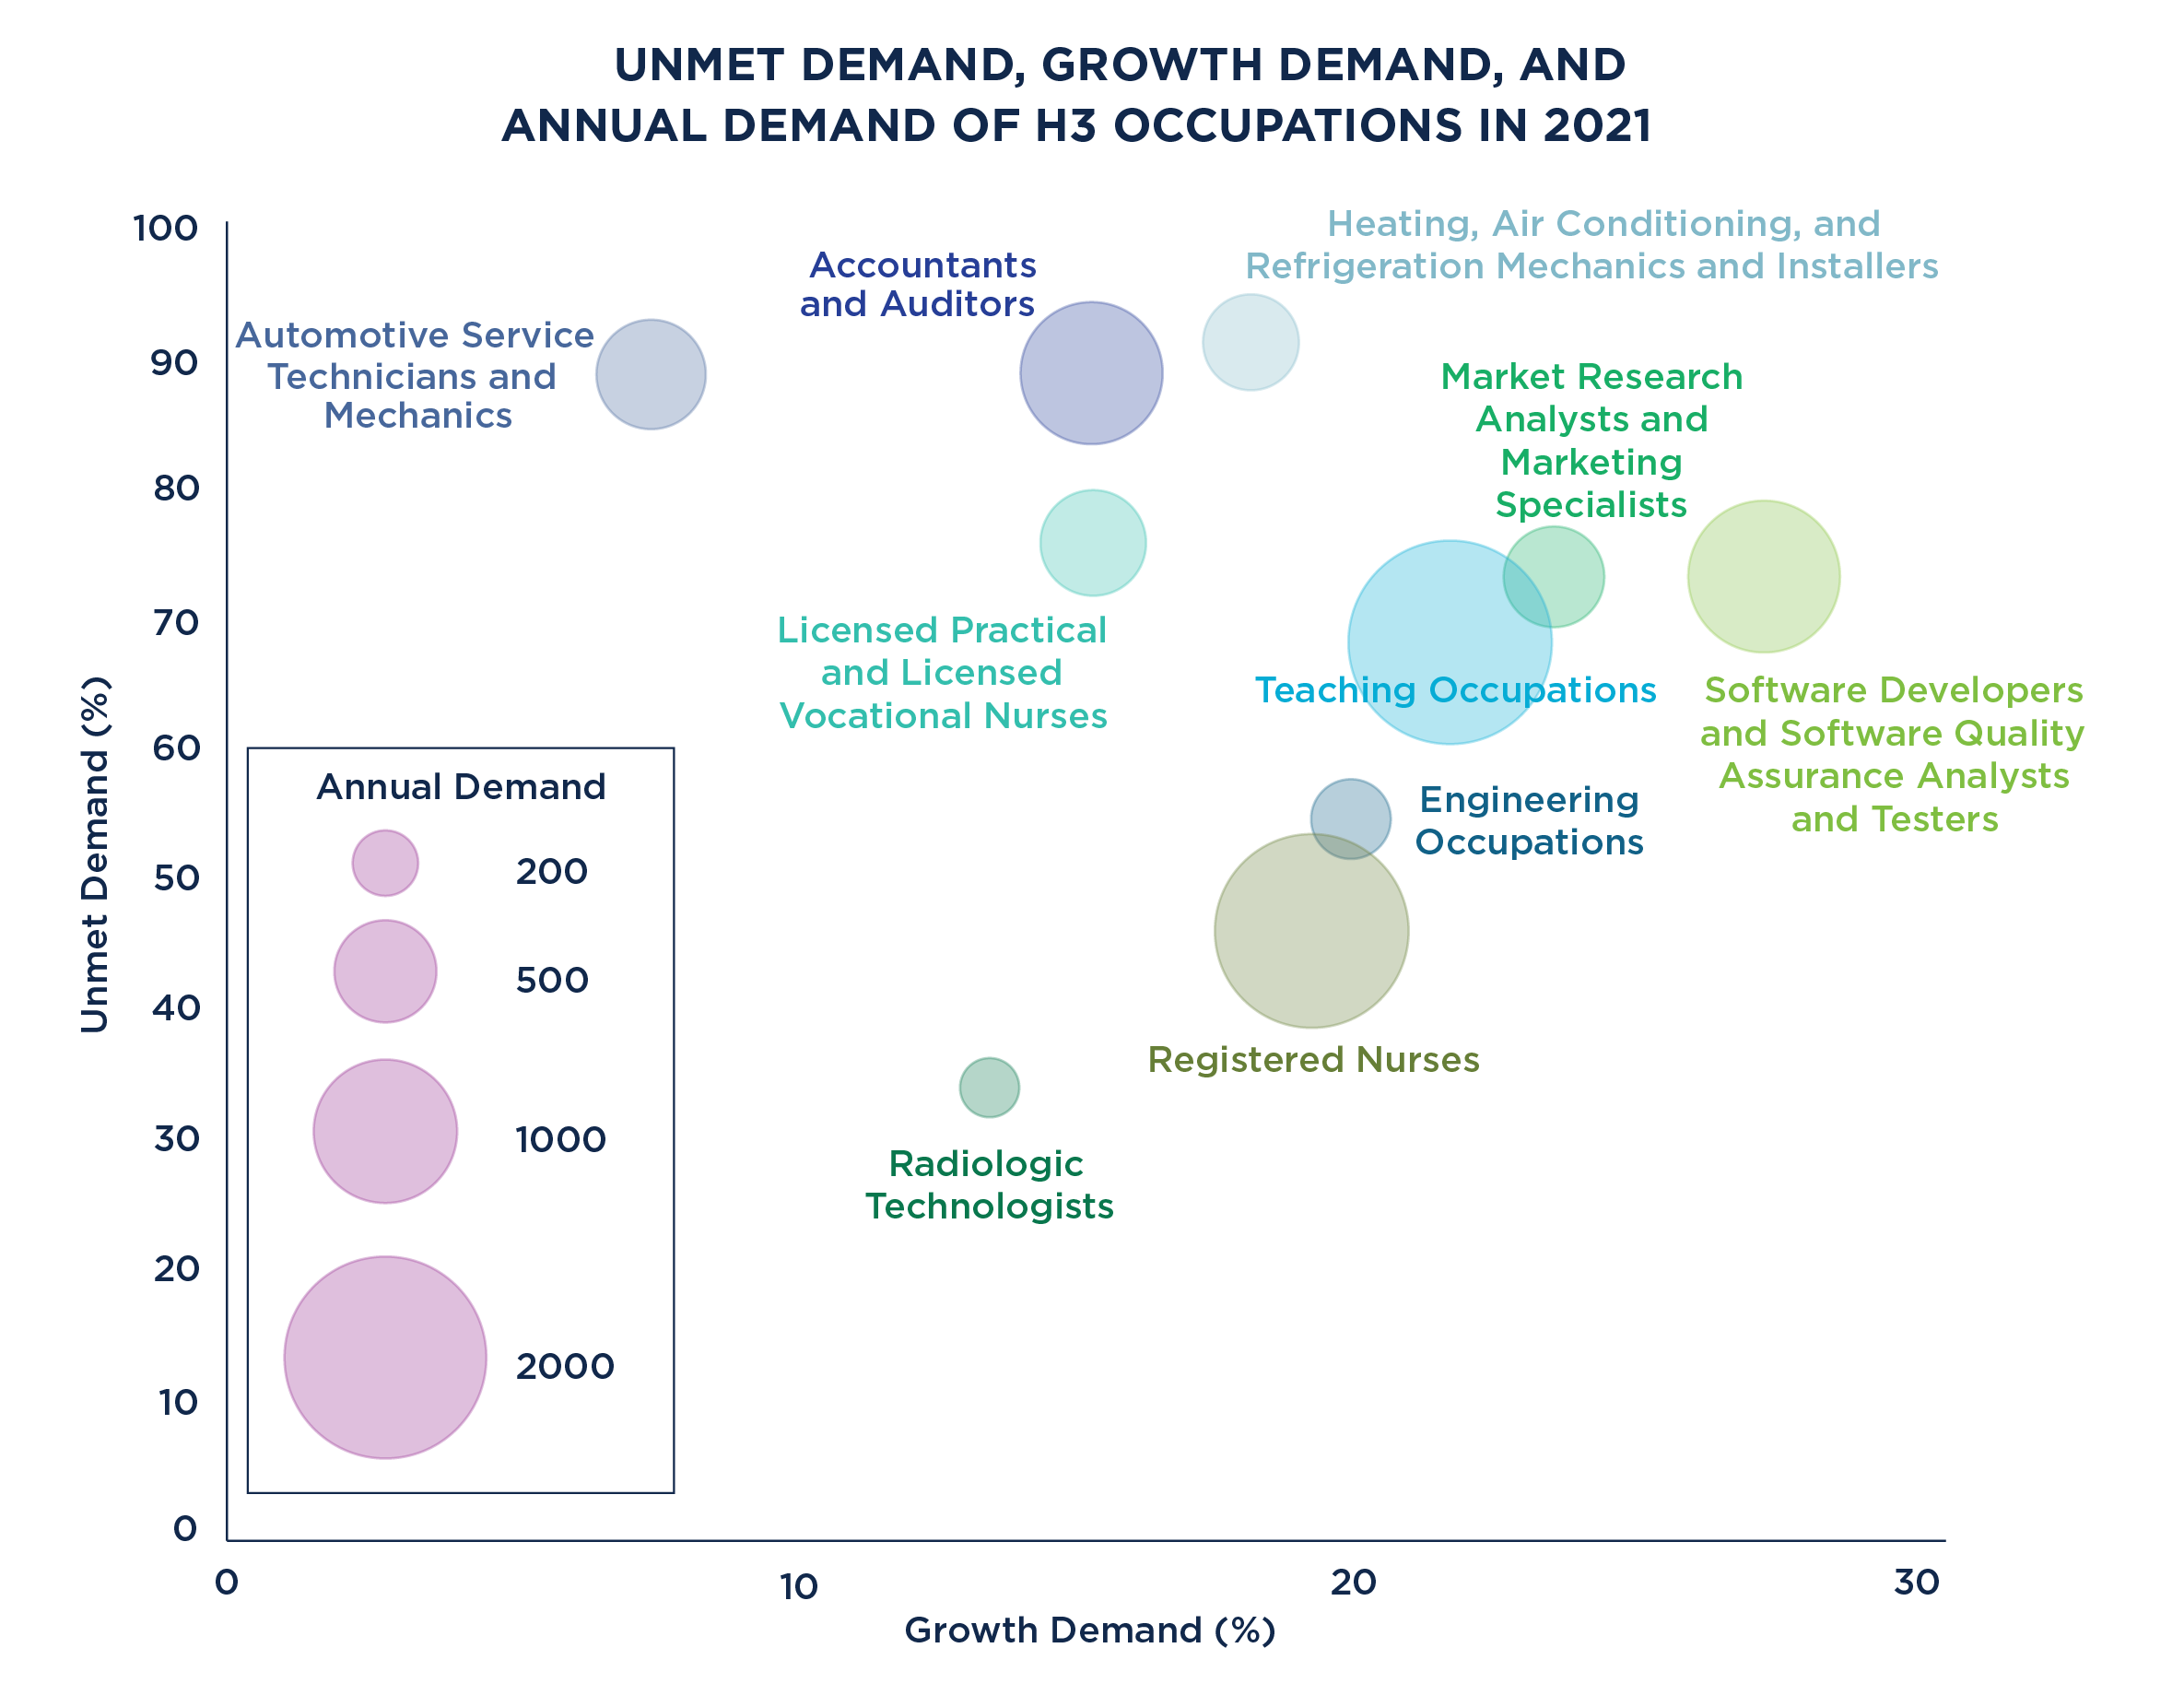
Unmet Demand, Growth Demand, and Annual Demand of H3 Occupations in 2021
In general, there is growth demand for these H3 occupations, which indicates that Nebraska’s workforce is growing. Software developers & quality assurance analysts have the largest growth demand. To learn more, see the NSWERS’ Employment Gap Brief here:...
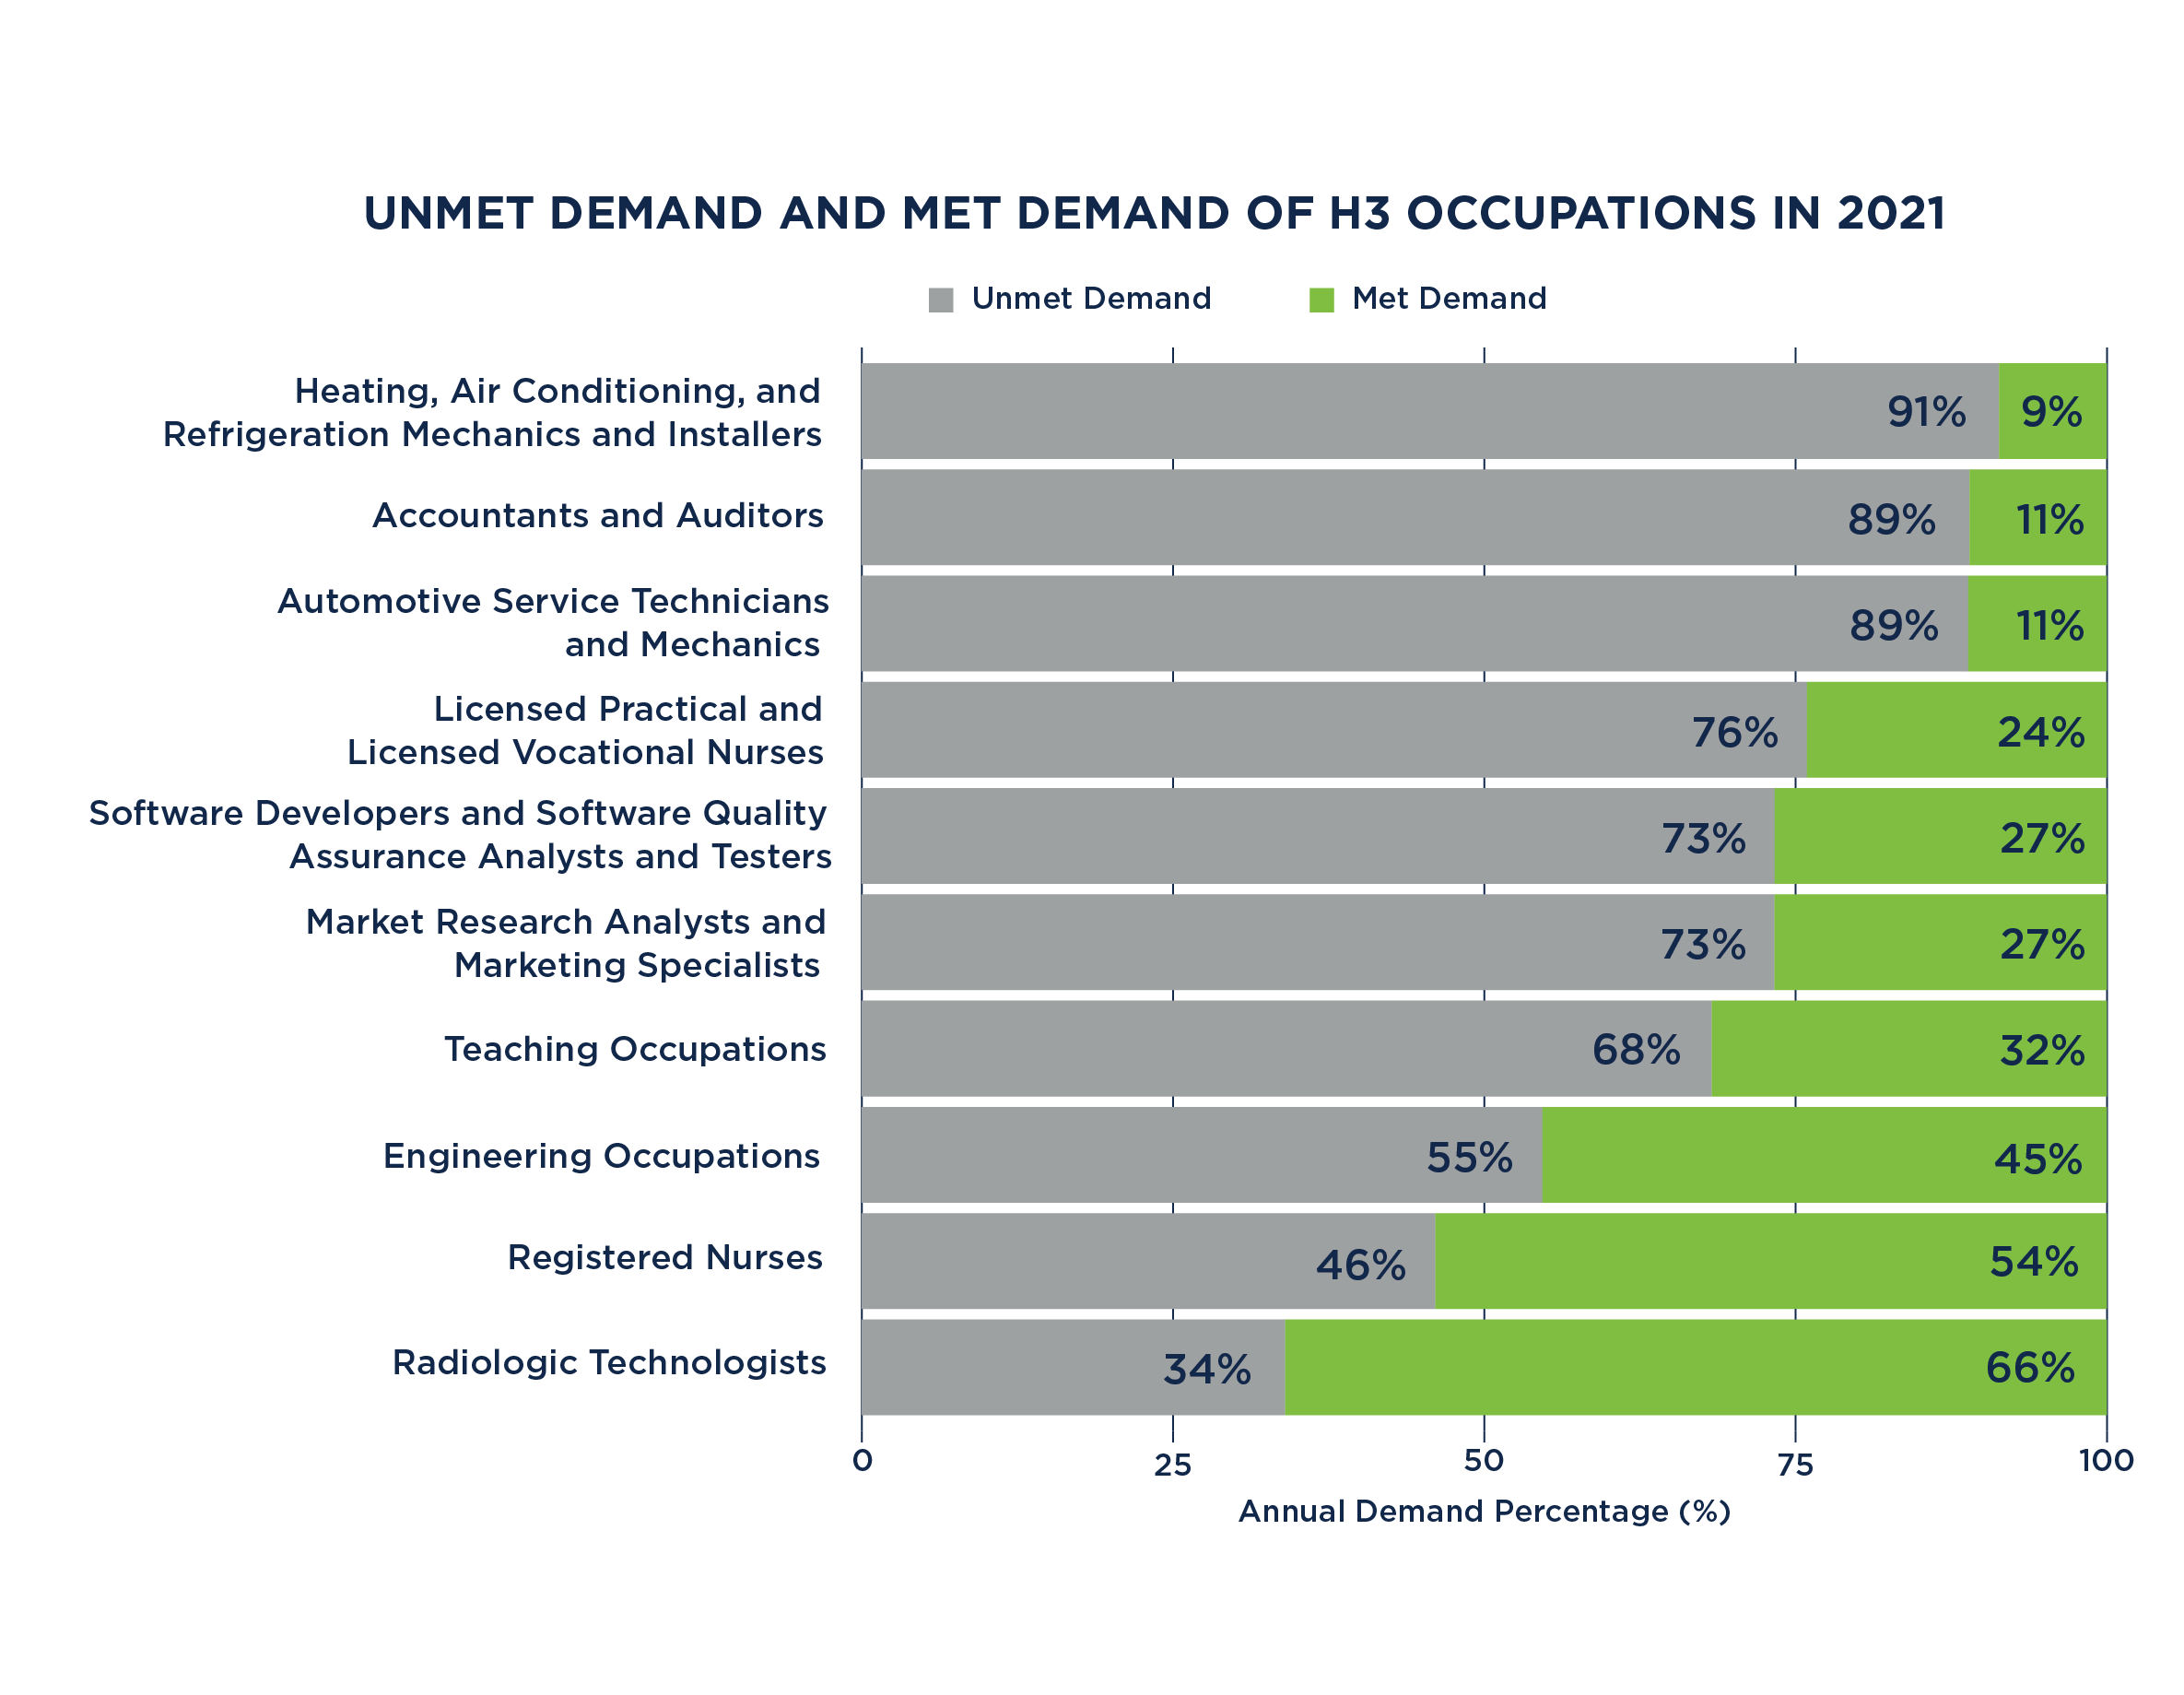
Unmet Demand and Met Demand of H3 Occupations in 2021
These selected occupations in Nebraska generally show a moderate to high rate of unmet demand, with more job openings than qualified graduates available to fill them. To learn more about the employment gap in Nebraska, visit:...
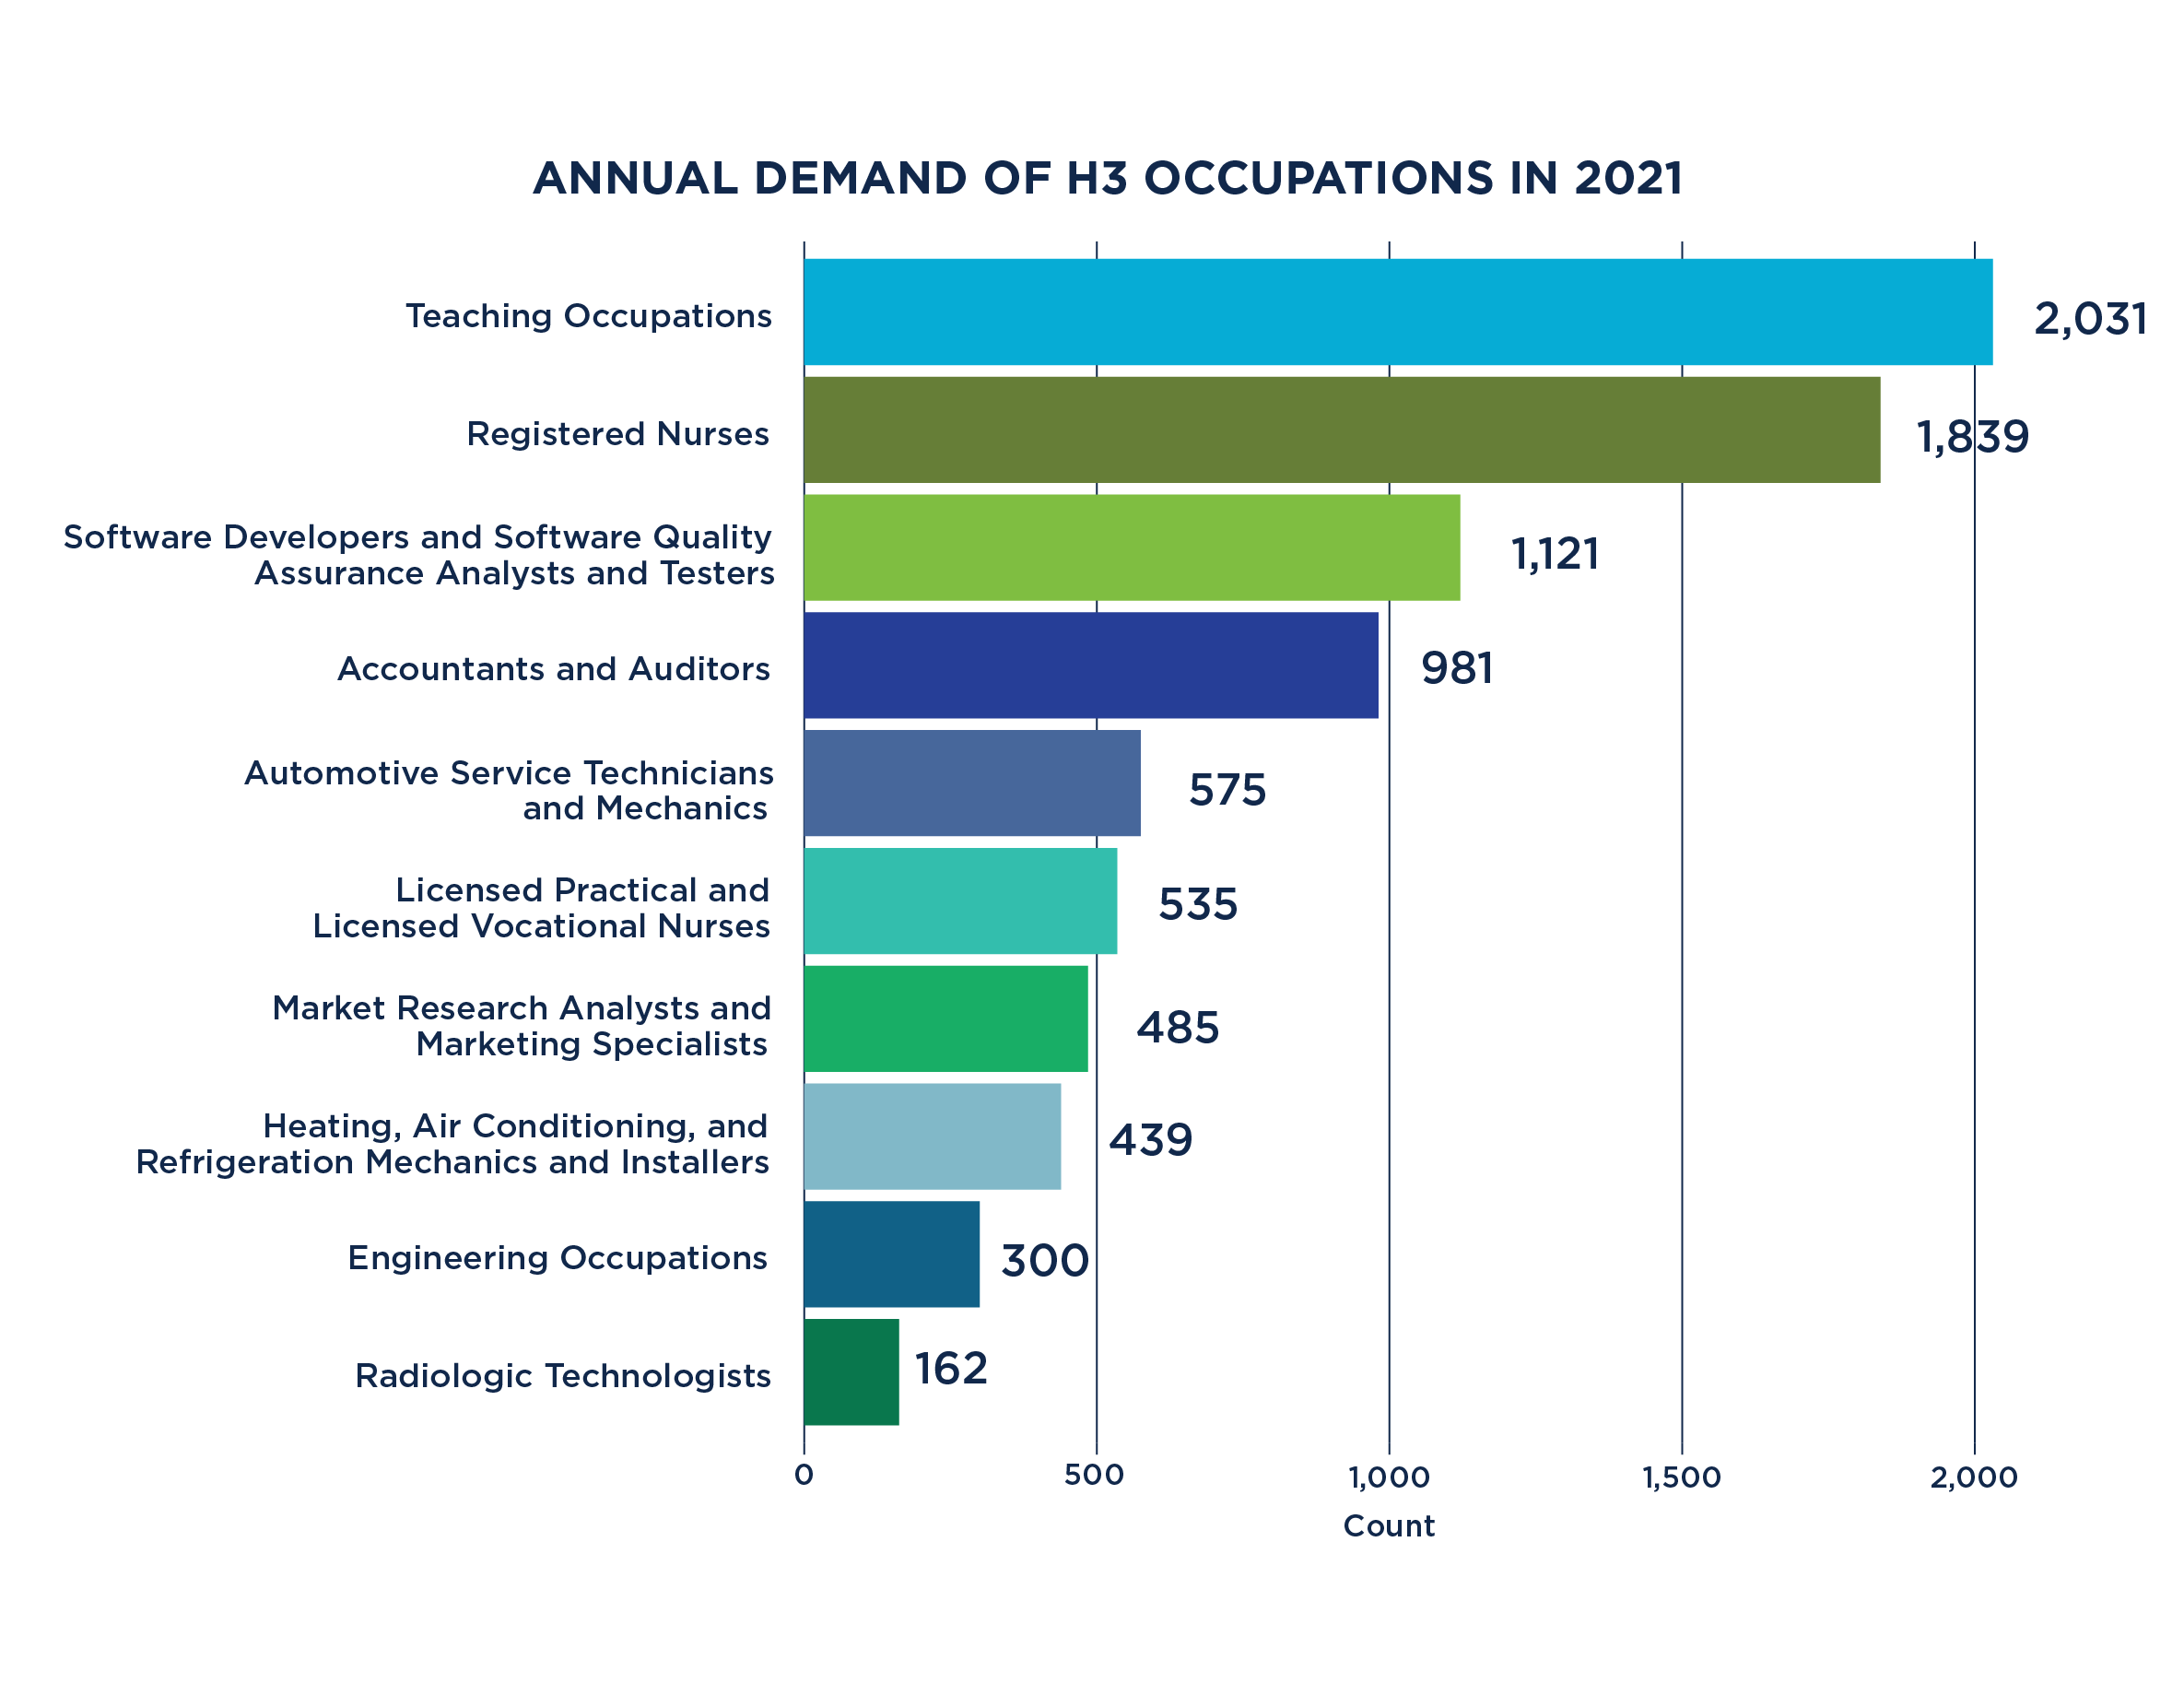
Annual Demand of H3 Occupations in 2021
In Nebraska, teaching jobs are in the highest annual demand for selected H3 occupations, followed by registered nurses. Read more about Nebraska's employment gap here: https://insights.nswers.org/briefs/nswers-employment-gap-brief-2025.pdf.

Timely employment
Timely employment is important for improving economic stability. NSWERS released a new report today that sheds light on the critical factors impacting how quickly Nebraska’s public college students secure stable employment after graduation:...
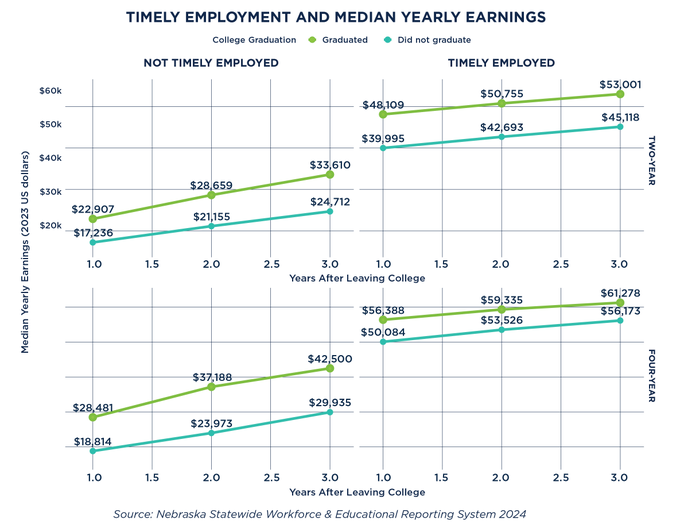
Median annual earnings for Nebraska public college students increase over time
Median annual earnings for Nebraska public college students increase over time, with noticeable gaps between graduates and non-graduates. Read more about timely employment in Nebraska at: https://insights.nswers.org/briefs/nswers-timely-employment-brief-2024.pdf.
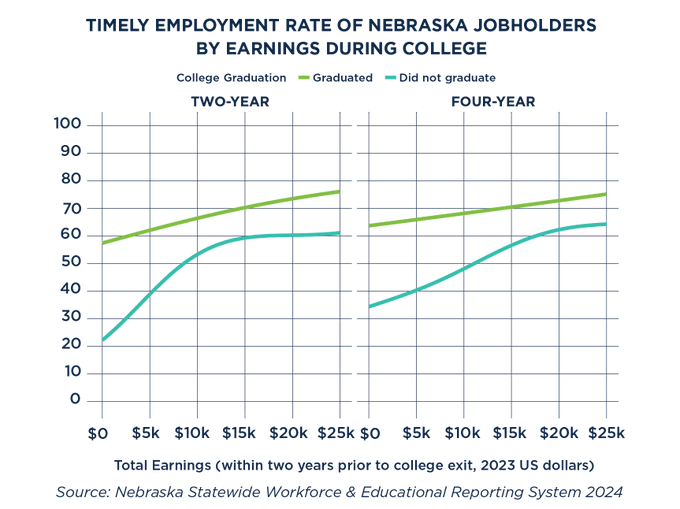
Work experience during college is crucial
Work experience during college is crucial in obtaining timely employment for graduates & non-graduates of Nebraska public colleges. Job holders who worked & earned more during college tend to have higher timely employment rates. Read more here:...
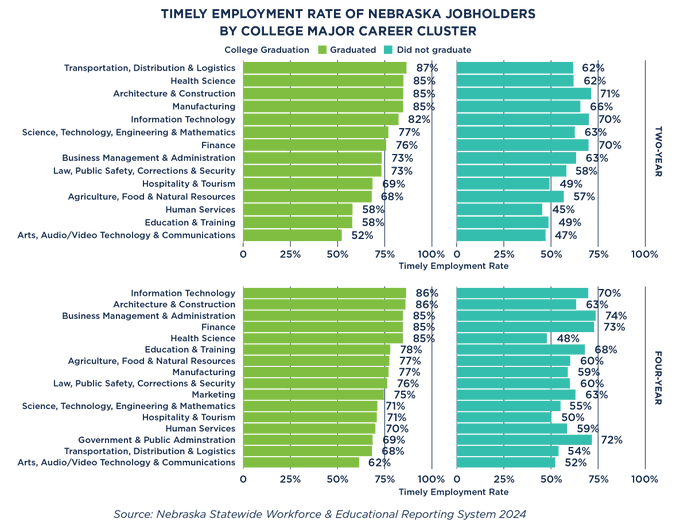
The rate of timely employment for Nebraska job holders
The rate of timely employment for #Nebraska job holders is closely linked to their choice of college major. Fields such as TDL, Health Sciences & Information Technology show high timely employment rates. Read more here:...
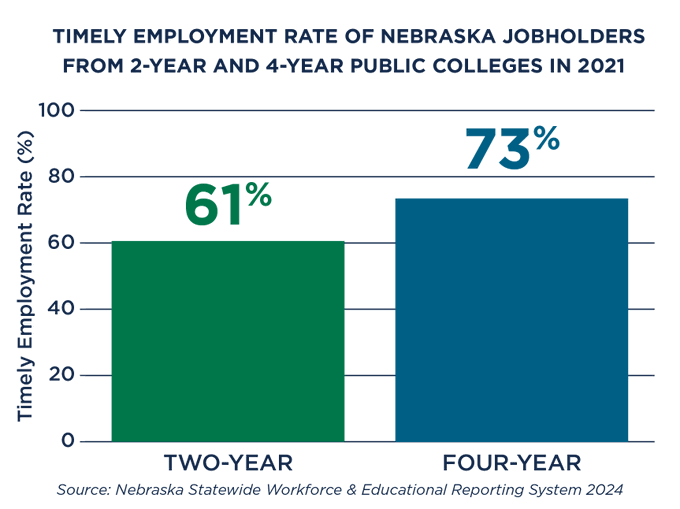
Job holders from Nebraska public 4-year colleges
Job holders from Nebraska public 4-year colleges are more likely to achieve timely employment, with a rate 12 points higher than those from Nebraska public 2-year colleges. Read more about timely employment in Nebraska:...
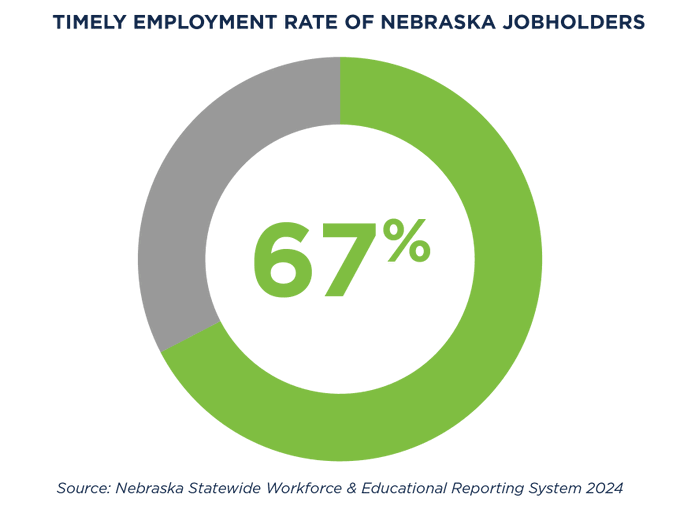
67% of Nebraska job holders secure stable employment
67% of Nebraska job holders secure stable employment within six months after leaving Nebraska public postsecondary institutions. For more on timely employment in the state, visit: https://insights.nswers.org/briefs/nswers-timely-employment-brief-2024.pdf.
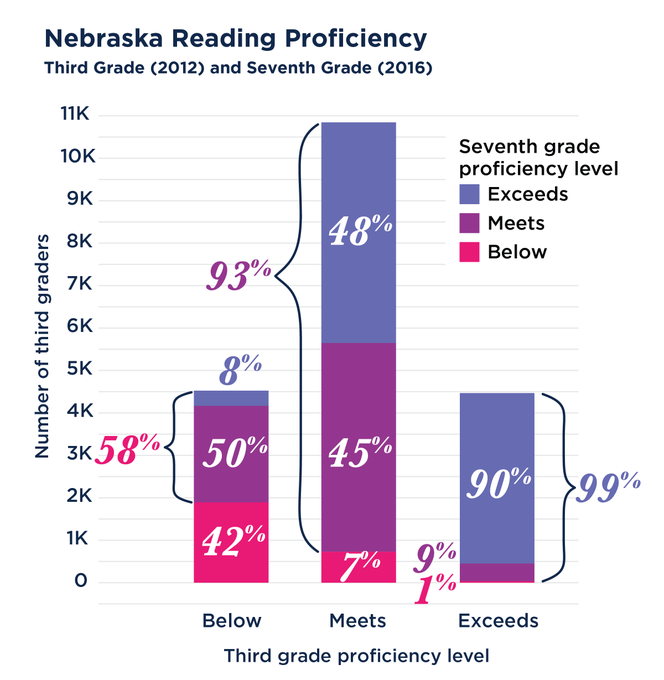
58% of Nebraska public students
58% of #Nebraska public students who had below standard third grade reading levels achieved reading proficiency by 7th grade, compared to 93% of students who met standards and 99% of students who exceeded standards. View the reading brief here:...
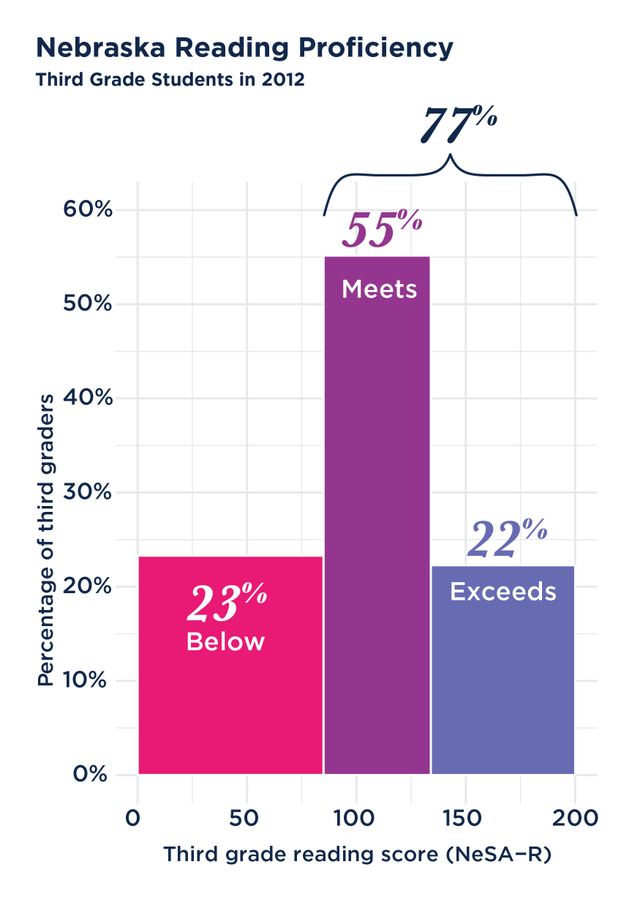
77% of third graders achieve reading scores
Did you know that 77% of third graders achieve reading scores on the #Nebraska state assessment that meet or exceed #reading standards? Read more about what happens later in their academic journey here:...
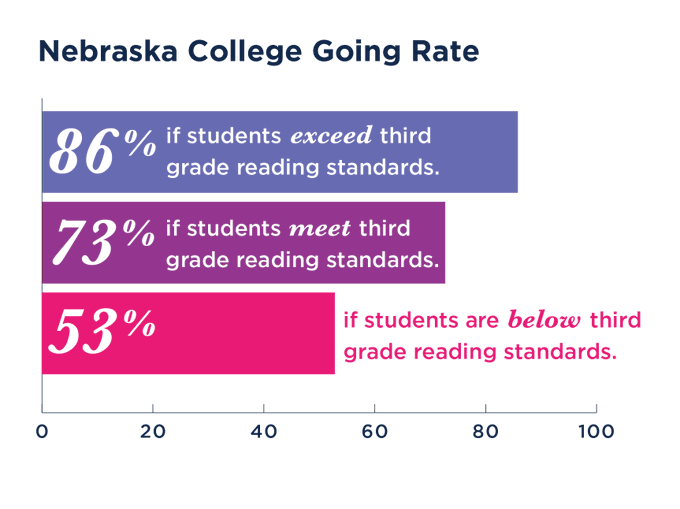
Students with better reading skills in 3rd grade
Students with better reading skills in 3rd grade are more likely to go to college. In 2021, Nebraska students went to college at rates of 86% if they exceeded 3rd grade reading standards, 73% if they met standards & just 53% if they were below. Read more:...
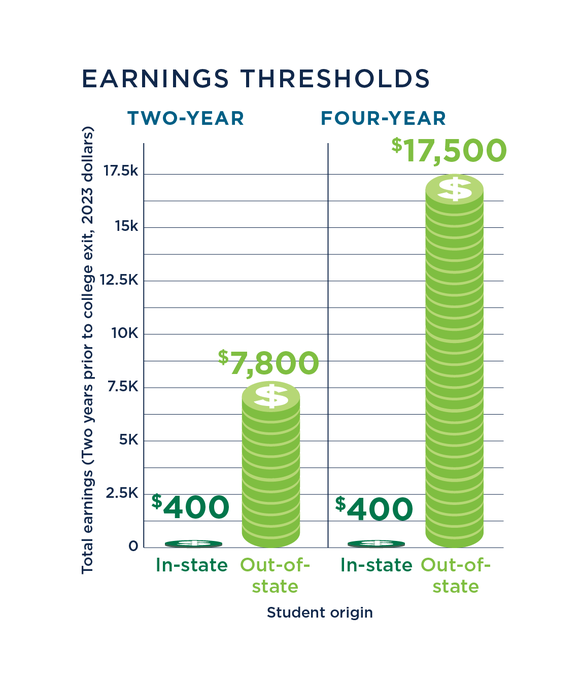
Providing prior meaningful in-state employment
Providing prior meaningful in-state employment opps is crucial for retaining talent in Nebraska. Earnings thresholds to achieve at least a 50% chance of talent retention are $400 for in-state & $7,800 for OOS 2-year students, & $400 for in-state & $17,500...
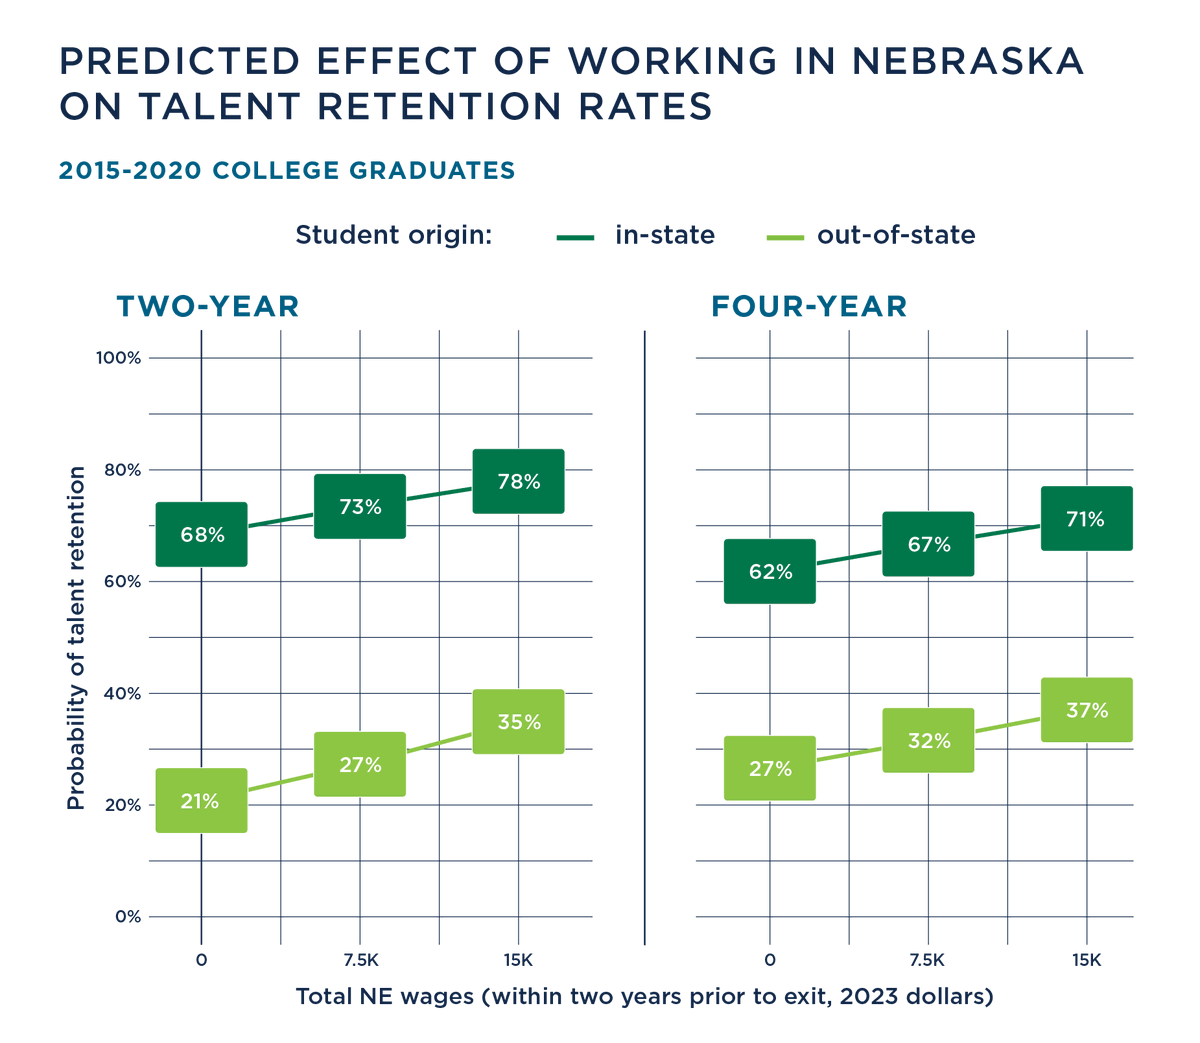
Predicted Effect of Working in Nebraska on Talent Retention Rates
Working in #Nebraska during college increases talent retention rates for both in-state and out-of-state, two-year and four-year college graduates. Learn more about talent retention in Nebraska: https://insights.nswers.org/briefs/nswers-talent-retention-brief-2024.pdf
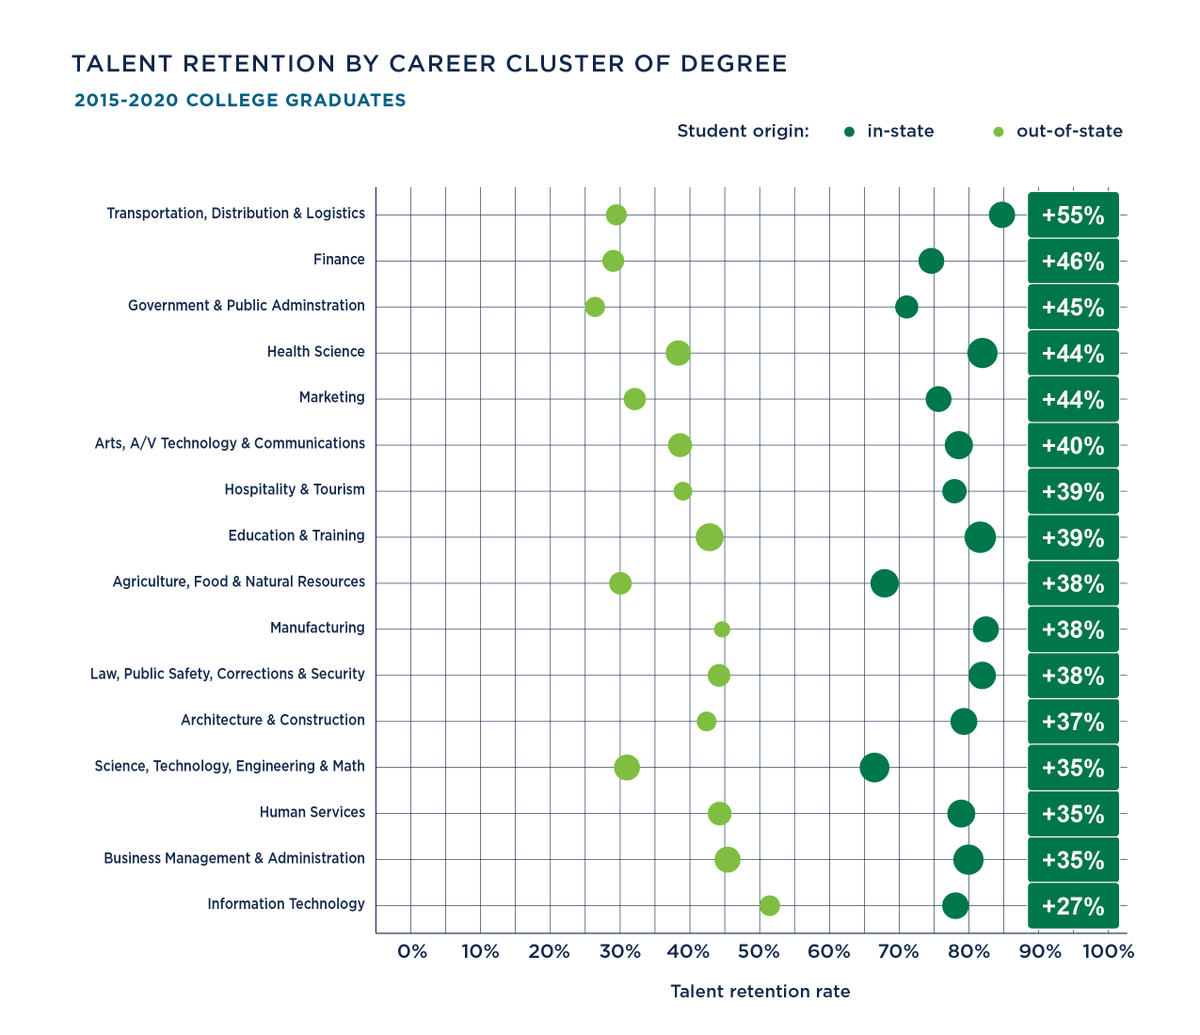
Talent Retention by Career Cluster of Degree
Nebraska in-state college grads generally have talent retention rates above 75%. Out-of-state grads tend to have talent retention rates below 45% which emphasizes the potential workforce gains Nebraska could make by improving talent retention rates for out-of-state...