2025 Dual Enrollment Special Report
SUPPLEMENTARY CONTENT
Foundational Courses: English
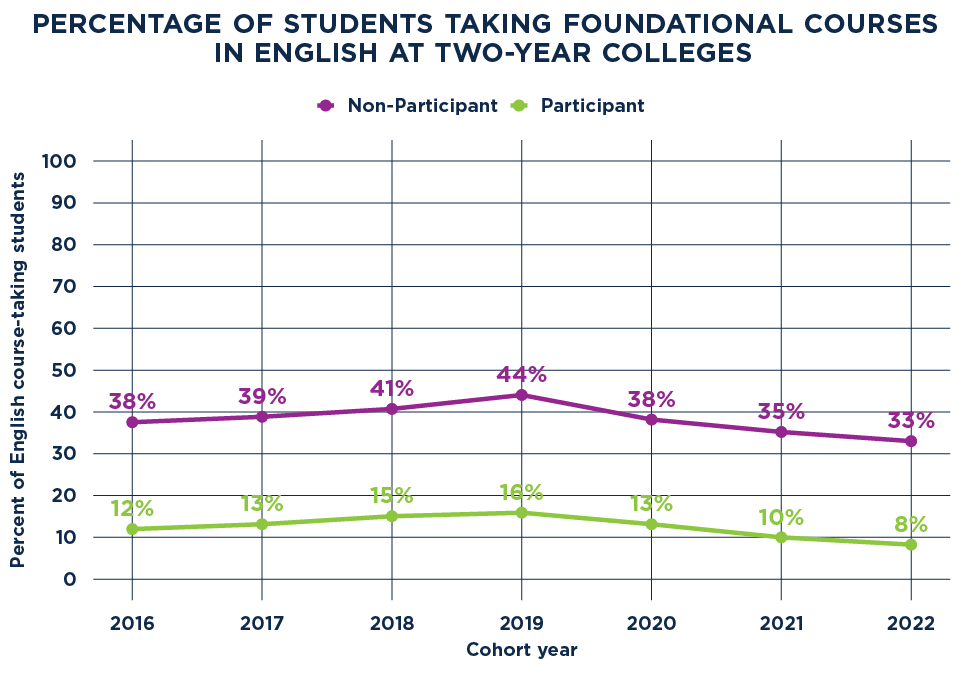
At Nebraska public two-year colleges, dual enrollment participants take fewer foundational English and math courses than non-participants. For English, about 33 percent of non-participants take foundational courses while about 8 percent of participants take foundational courses. These differences in foundational course taking for English may partly explain the benefit of dual enrollment course taking for degree completion at two-year colleges, since English proficiency is less likely to be a barrier to degree completion.
Rates and counts of foundational English course taking
| Cohort year | Dual Enrollment | Rate | Foundational | Non-Foundational | Total |
| 2016 | Non-Participant | 0.38 | 1,176 | 1,957 | 3,133 |
| 2016 | Participant | 0.12 | 343 | 2,521 | 2,864 |
| 2017 | Non-Participant | 0.39 | 1,141 | 1,797 | 2,938 |
| 2017 | Participant | 0.13 | 392 | 2,592 | 2,984 |
| 2018 | Non-Participant | 0.41 | 1,125 | 1,638 | 2,763 |
| 2018 | Participant | 0.15 | 495 | 2,794 | 3,289 |
| 2019 | Non-Participant | 0.44 | 1,115 | 1,416 | 2,531 |
| 2019 | Participant | 0.16 | 538 | 2,846 | 3,384 |
| 2020 | Non-Participant | 0.38 | 794 | 1,286 | 2,080 |
| 2020 | Participant | 0.13 | 446 | 2,948 | 3,394 |
| 2021 | Non-Participant | 0.35 | 653 | 1,202 | 1,855 |
| 2021 | Participant | 0.10 | 329 | 2,962 | 3,291 |
| 2022 | Non-Participant | 0.33 | 471 | 956 | 1,427 |
| 2022 | Participant | 0.08 | 291 | 3,236 | 3,527 |
Foundational Courses: Math
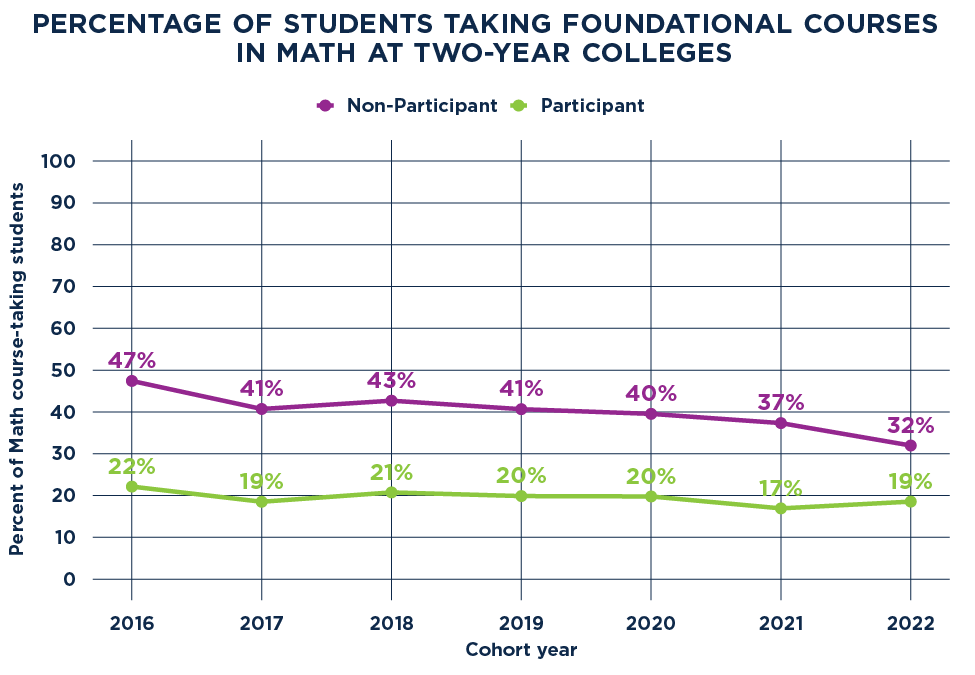
In math, about 32 percent of non-participants need foundational instruction compared to 18 percent of participants. These differences in foundational course taking for math may partly explain the benefit of dual enrollment course taking for degree completion at two-year colleges, since math proficiency is less likely to be a barrier to degree completion.
Rates and counts of foundational math course taking
| Cohort year | Dual enrollment | Rate | Foundational | Non-Foundational | Total |
| 2016 | Non-Participant | 0.47 | 1,382 | 1,533 | 2,915 |
| 2016 | Participant | 0.22 | 562 | 1,976 | 2,538 |
| 2017 | Non-Participant | 0.41 | 1,086 | 1,582 | 2,668 |
| 2017 | Participant | 0.19 | 518 | 2,281 | 2,799 |
| 2018 | Non-Participant | 0.43 | 1,083 | 1,454 | 2,537 |
| 2018 | Participant | 0.21 | 656 | 2,506 | 3,162 |
| 2019 | Non-Participant | 0.41 | 957 | 1,397 | 2,354 |
| 2019 | Participant | 0.20 | 633 | 2,553 | 3,186 |
| 2020 | Non-Participant | 0.40 | 782 | 1,196 | 1,978 |
| 2020 | Participant | 0.20 | 663 | 2,689 | 3,352 |
| 2021 | Non-Participant | 0.37 | 695 | 1,167 | 1,862 |
| 2021 | Participant | 0.17 | 598 | 2,935 | 3,533 |
| 2022 | Non-Participant | 0.32 | 475 | 1,011 | 1,486 |
| 2022 | Participant | 0.19 | 698 | 3,065 | 3,763 |
Course Instruction Mode
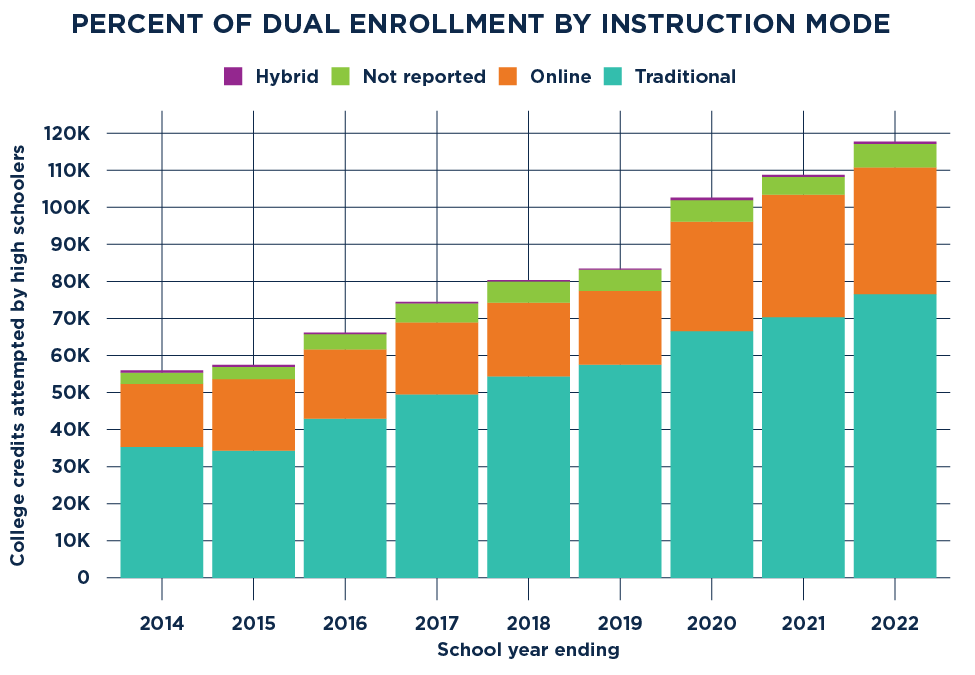
Dual enrollment courses can be delivered in multiple ways: traditionally, via face-to-face instruction; online; or a hybrid of these two modes. Of the courses with known instruction modes, the majority of dual enrollment credit courses are still delivered traditionally in a classroom at nearly 53 percent. However, online courses grew more popular over the last year with 41 percent of all dual enrollment courses now taught online. About 5 percent of courses are hybrid.
| School Year Ending | Hybrid | Online | Traditional | Not Reported |
| 2012 | 620 | 2,841 | 24,310 | 3,556 |
| 2013 | 1,056 | 13,610 | 31,628 | 3,334 |
| 2014 | 615 | 16,986 | 35,341 | 3,040 |
| 2015 | 536 | 19,240 | 34,362 | 3,302 |
| 2016 | 387 | 18,696 | 42,966 | 4,098 |
| 2017 | 375 | 19,376 | 49,528 | 5,174 |
| 2018 | 361 | 19,935 | 54,361 | 5,672 |
| 2019 | 283 | 19,913 | 57,552 | 5,708 |
| 2020 | 623 | 29,574 | 66,564 | 5,822 |
| 2021 | 560 | 33,060 | 70,332 | 4,811 |
| 2022 | 662 | 34,203 | 76,586 | 6,295 |
Postsecondary Award Attainment
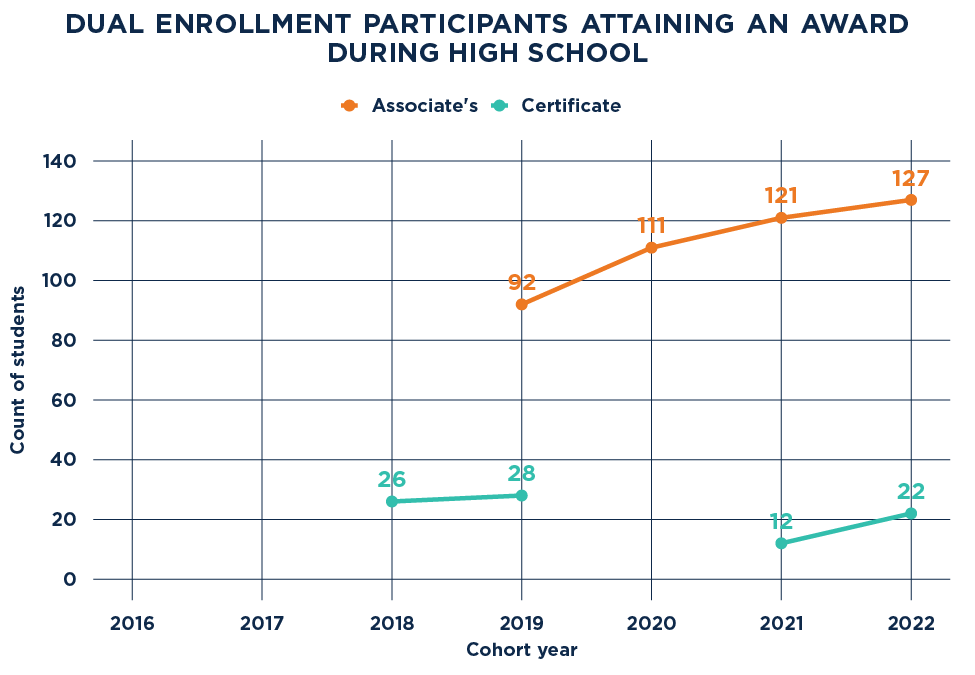
While the purpose of dual enrollment is not necessarily for high school students to earn college certificates or degrees, some students attempt to do so. At least one Nebraska public high school, Millard South, has an early college program designed to help students earn an associate’s degree while still in high school. In 2022, most of the awards (86 percent) earned by students during or shortly after high school are associate’s versus 14 percent for certificates. Many of these students are enrolled at Millard South.
| Cohort Year | Associate’s Degree | Certificate |
| 2016 | * | * |
| 2017 | * | * |
| 2018 | * | 26 |
| 2019 | 92 | 28 |
| 2020 | 111 | * |
| 2021 | 121 | 12 |
| 2022 | 127 | 22 |
* Data has been suppressed to protect data privacy.
Other Variables
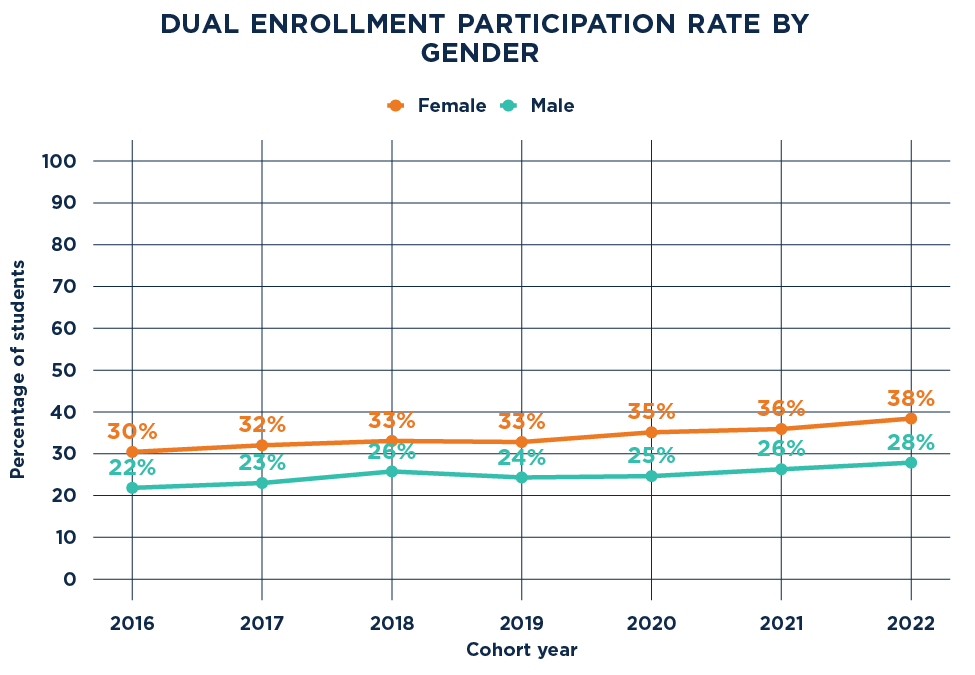
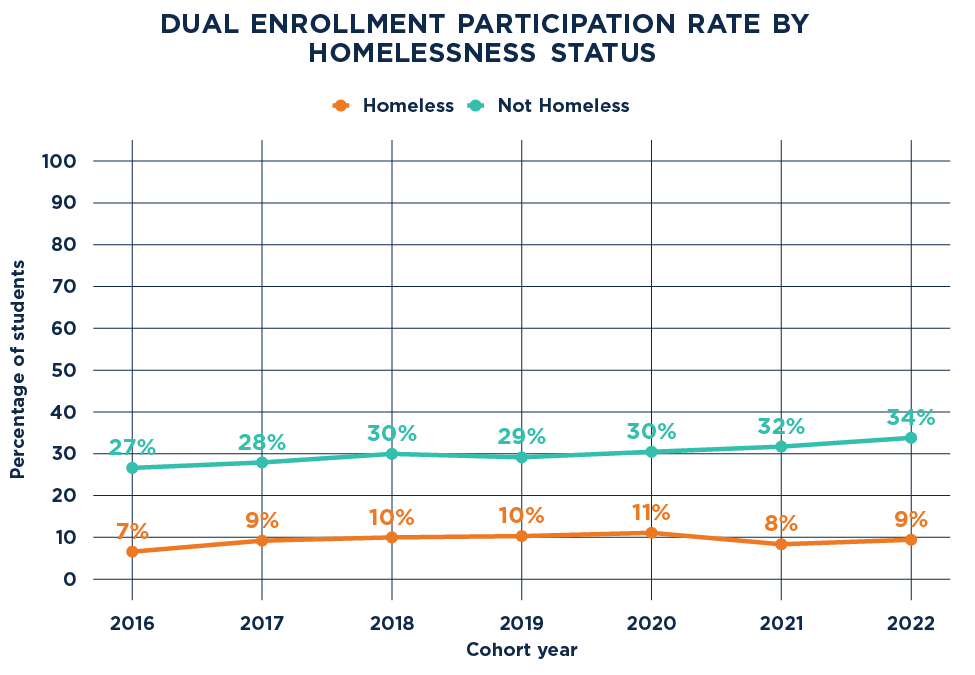
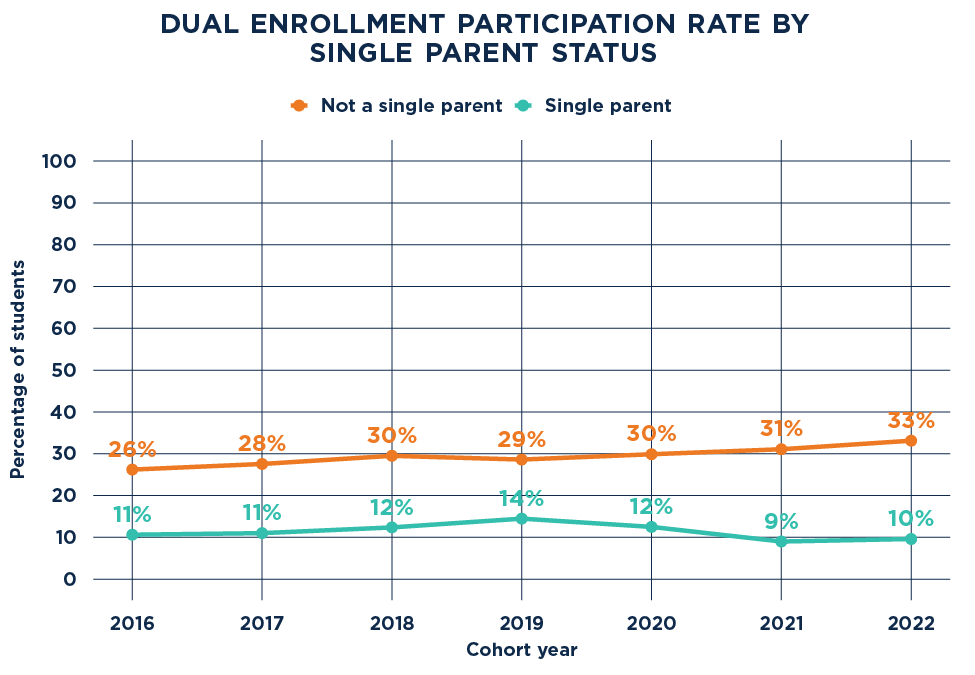
In this section, the observed effect of different student characteristics on the likelihood of a student earning dual enrollment credit is shown. Specifically, for each of the student characteristics considered in this section, the percentage of students within each category who earned dual enrollment credit is estimated. Note that these percentages will not add to 100 percent because the percentage is the number of dual credit earners from each category, divided by the total number of students in the category. For instance, to determine the effect of single parenthood on the likelihood of dual credit attainment, the number of dual credit earners who are single parents were divided by the total number of single parents. This percentage is more appropriate for the goal of this section, compared to calculating what percentage of dual credit earners are single parents.
Assessment
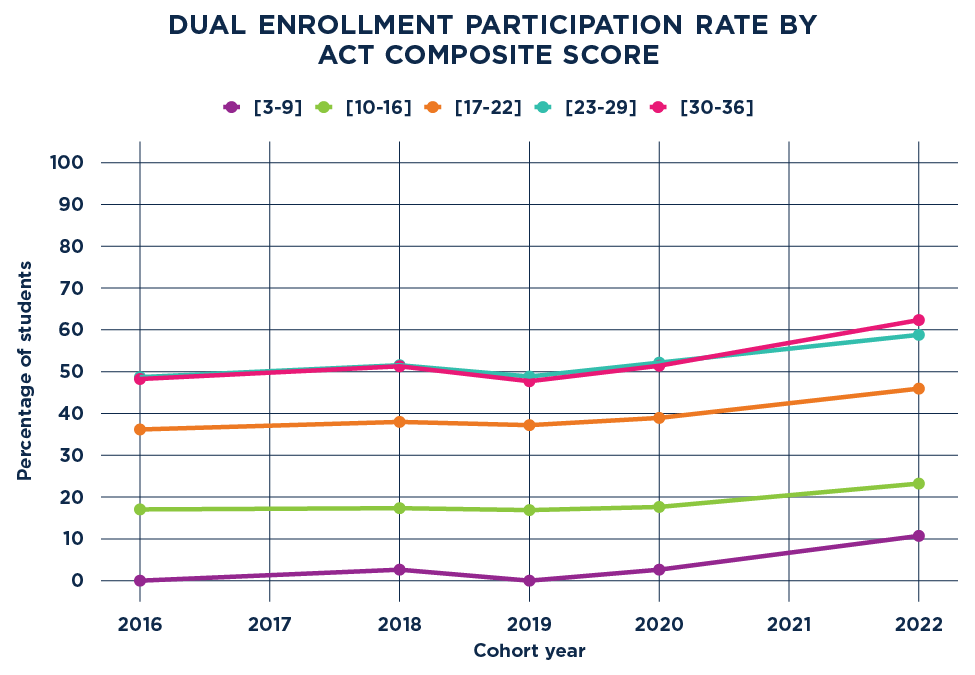
ACT score data is not available for all years due to data limitations. Quintiles of the ACT composite scores were used to create score categories to calculate dual enrollment participation rates.
|
Cohort year |
[3-9] |
[10-16] |
[17-22] |
[23-29] |
[30-36] |
| 2016 | 0.0 | 17.0 | 36.2 | 48.7 | 48.2 |
| 2017 | * | * | * | * | * |
| 2018 | 2.6 | 17.3 | 38.0 | 51.5 | 51.3 |
| 2019 | 0.0 | 16.9 | 37.2 | 48.8 | 47.7 |
| 2020 | 2.6 | 17.6 | 38.9 | 52.2 | 51.4 |
| 2021 | * | * | * | * | * |
| 2022 | 10.7 | 23.2 | 45.9 | 58.8 | 62.3 |
* Data has been suppressed.
Chronic Absenteeism
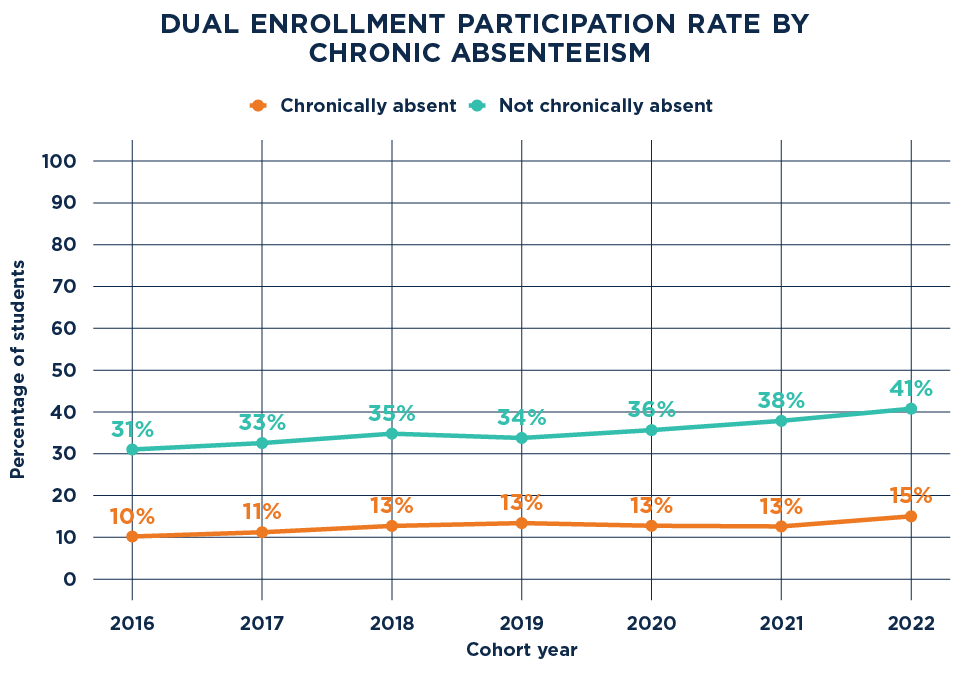
Students are categorized as chronically absent if they missed more than or equal to 10 percent of school days during high school.
|
Cohort year |
Chronically absent |
Not chronically absent |
|
2016 |
10.2 |
31.0 |
|
2017 |
11.2 |
32.5 |
|
2018 |
12.7 |
34.8 |
|
2019 |
13.4 |
33.8 |
|
2020 |
12.8 |
35.6 |
|
2021 |
12.6 |
37.9 |
|
2022 |
15.0 |
40.8 |
English Language Learner
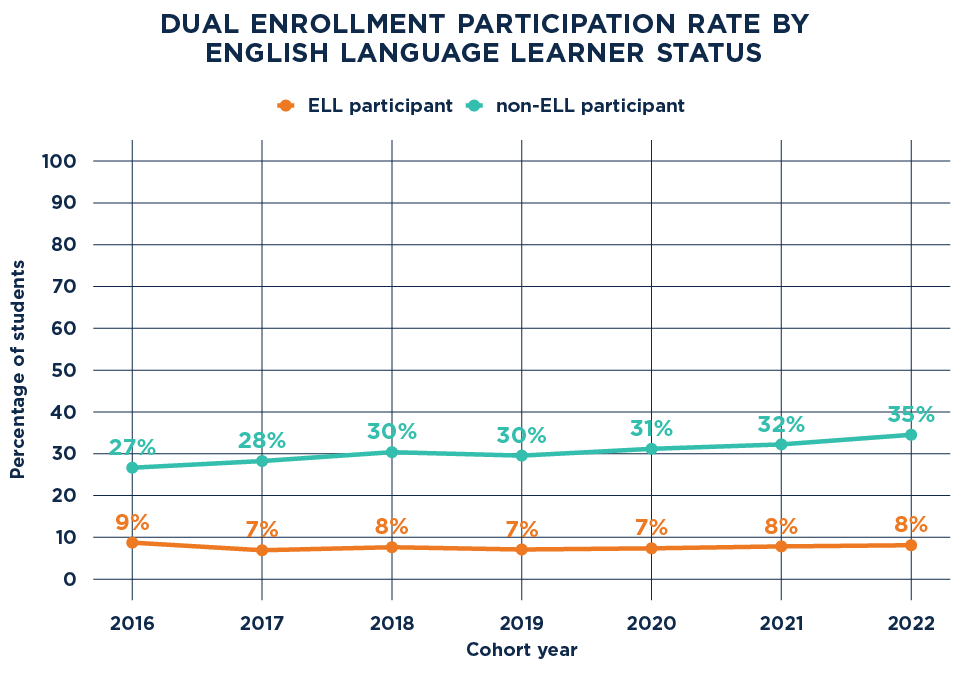
Students are categorized as English Language Learners if at any time they participated in an English Language Learners program during high school.
| Cohort Year | ELL Participant | Non-ELL Participant |
| 2016 | 8.7 | 26.6 |
| 2017 | 6.9 | 28.2 |
| 2018 | 7.6 | 30.4 |
| 2019 | 7.1 | 29.5 |
| 2020 | 7.4 | 31.2 |
| 2021 | 7.8 | 32.2 |
| 2022 | 8.1 | 34.5 |
High Ability Learner
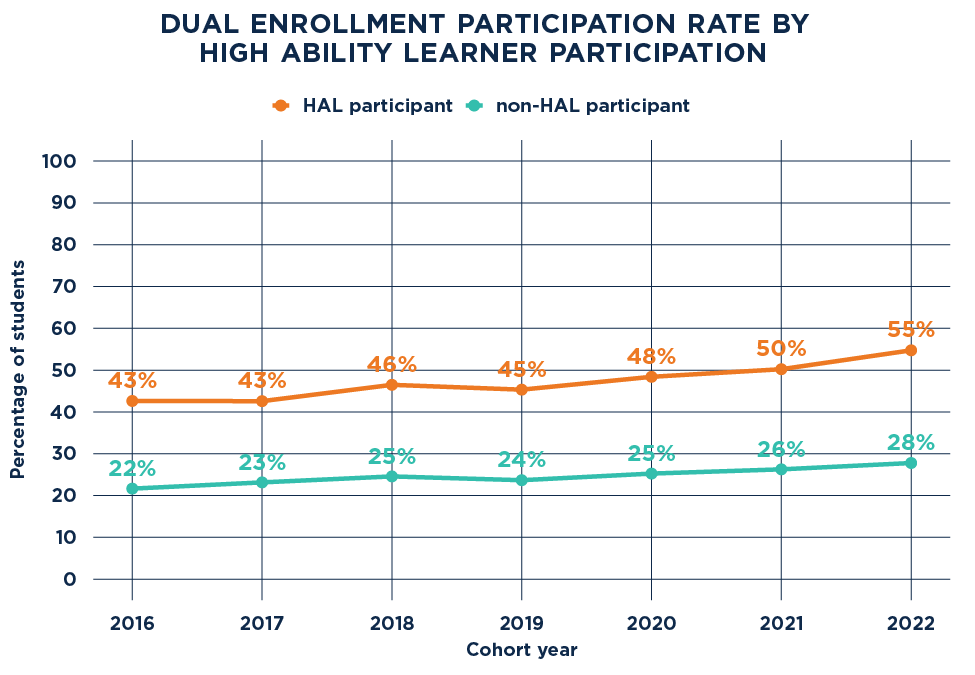
Students are categorized as high ability learners if at any time they participated in a high ability learners program during high school.
|
Cohort Year |
HAL Participant |
Non-HAL Participant |
|
2016 |
42.6 |
21.7 |
|
2017 |
42.6 |
23.1 |
|
2018 |
46.5 |
24.6 |
|
2019 |
45.3 |
23.7 |
|
2020 |
48.4 |
25.3 |
|
2021 |
50.2 |
26.3 |
|
2022 |
54.7 |
27.8 |
Immigrant Status
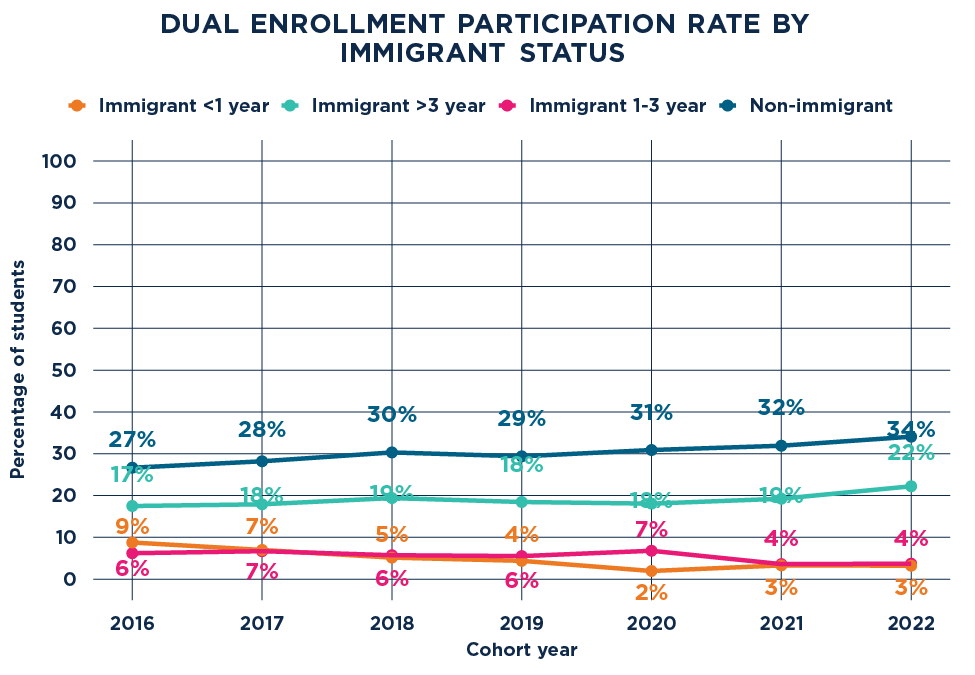
Student immigrant status is determined by time since immigration. Since immigration status can change from year to year as a student progresses through high school, the most recent designation is used. For instance, if a student was recorded as “immigrant <1 year” in ninth grade then “immigrant 1-3 years” in grades 10 through 12, this student would be categorized as “immigrant 1-3 years” in the following tables and charts.
|
Cohort Year |
Immigrant 1-3 year |
Immigrant <1 year |
Immigrant >3 year |
Non-immigrant |
|
2016 |
6.2 |
8.8 |
17.5 |
26.7 |
|
2017 |
6.7 |
7.0 |
17.9 |
28.2 |
|
2018 |
5.7 |
5.1 |
19.4 |
30.3 |
|
2019 |
5.5 |
4.4 |
18.5 |
29.4 |
|
2020 |
6.8 |
2.0 |
18.1 |
30.9 |
|
2021 |
3.6 |
3.3 |
19.2 |
31.9 |
|
2022 |
3.7 |
3.2 |
22.2 |
34.1 |
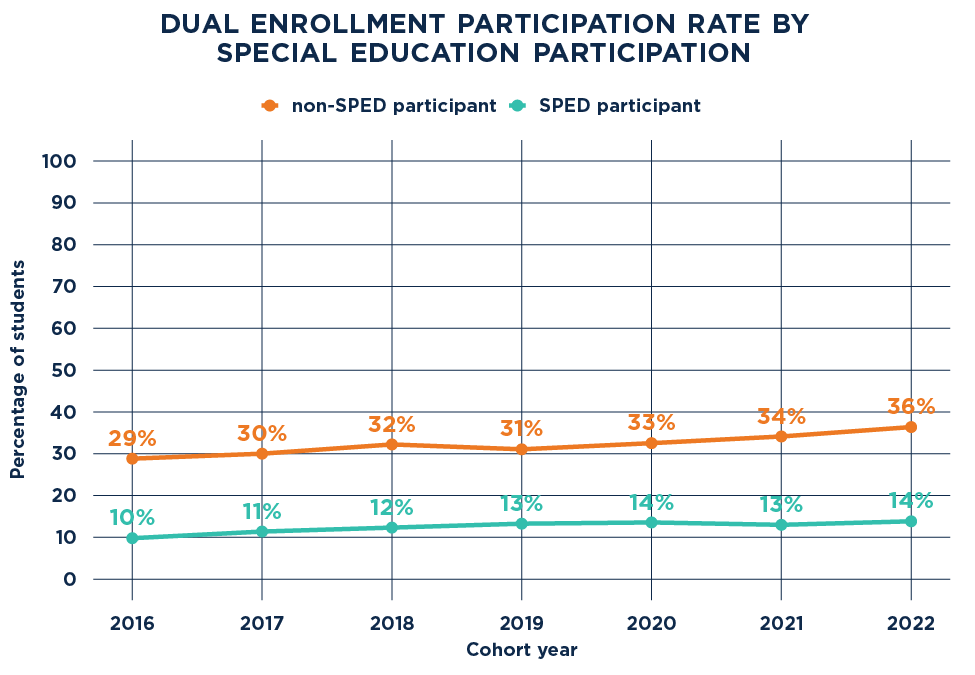
Special Education
Students are categorized as special education if at any time they participated in a special education program during high school.
|
Cohort Year |
SPED Participant |
Non-SPED Participant |
|
2016 |
9.8 |
28.8 |
|
2017 |
11.4 |
30.0 |
|
2018 |
12.3 |
32.2 |
|
2019 |
13.3 |
31.1 |
|
2020 |
13.6 |
32.5 |
|
2021 |
13.0 |
34.1 |
|
2022 |
13.8 |
36.4 |
These provisional results are based on certified NSWERS data as of March 13, 2025. The provisional results in this report may change because of data resubmissions by NSWERS Partners and/or Affiliates. While NSWERS strives for accuracy and reliability, official estimates should be obtained directly from the respective partners. For updated results, please contact support@nswers.org.


