
EDUCATION OUTCOME
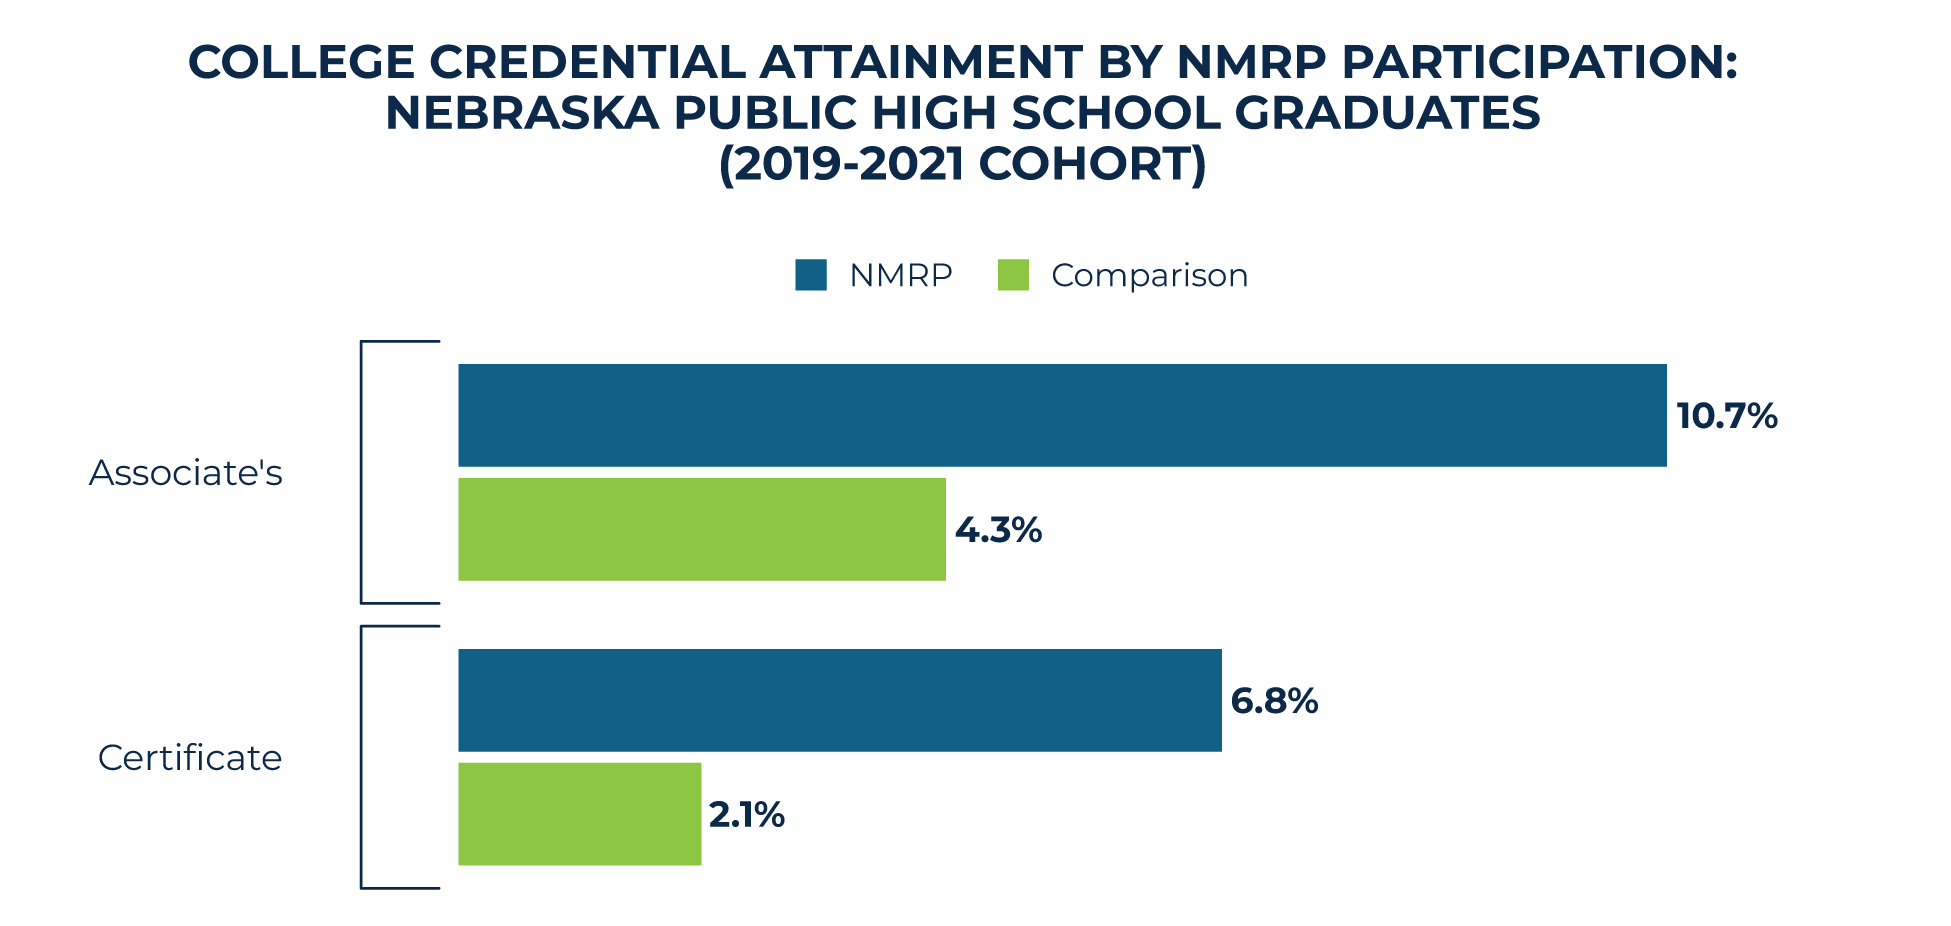
2026 NMRP Attainment
Nebraska Math Readiness Project participants have higher attainment rates for two-year certificates & associate degrees compared to their counterparts. For more about NMRP, visit: https://insights.nswers.org/evaluations/nmrpmcc2026.
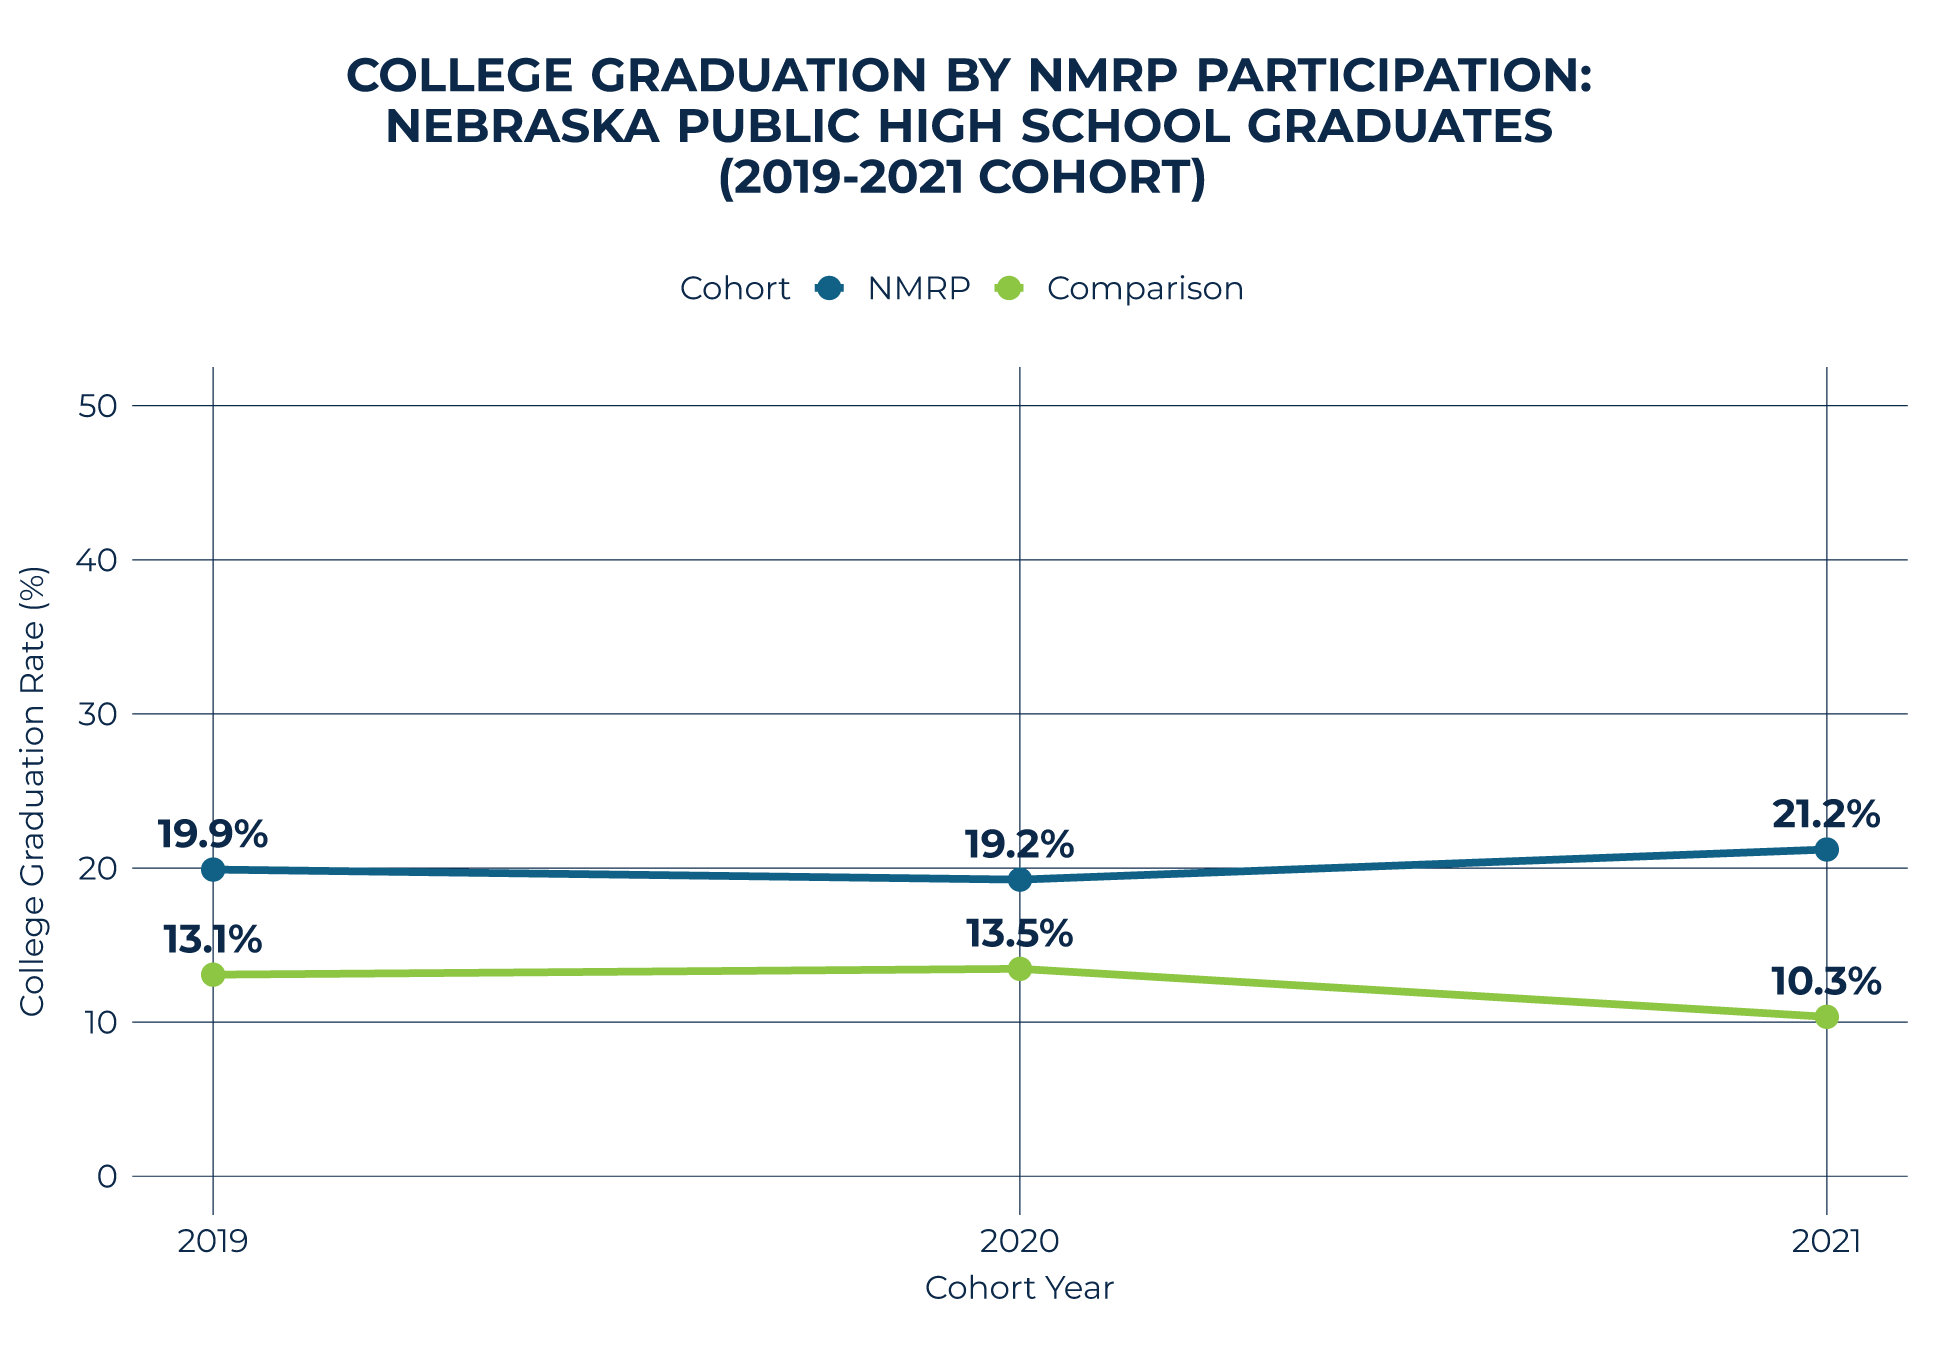
2026 NMRP College Grad
On average, the college graduation rate of Nebraska Math Readiness Project participants is 7 percentage points higher than their peers. Learn more about NMRP: https://insights.nswers.org/evaluations/nmrpmcc2026.
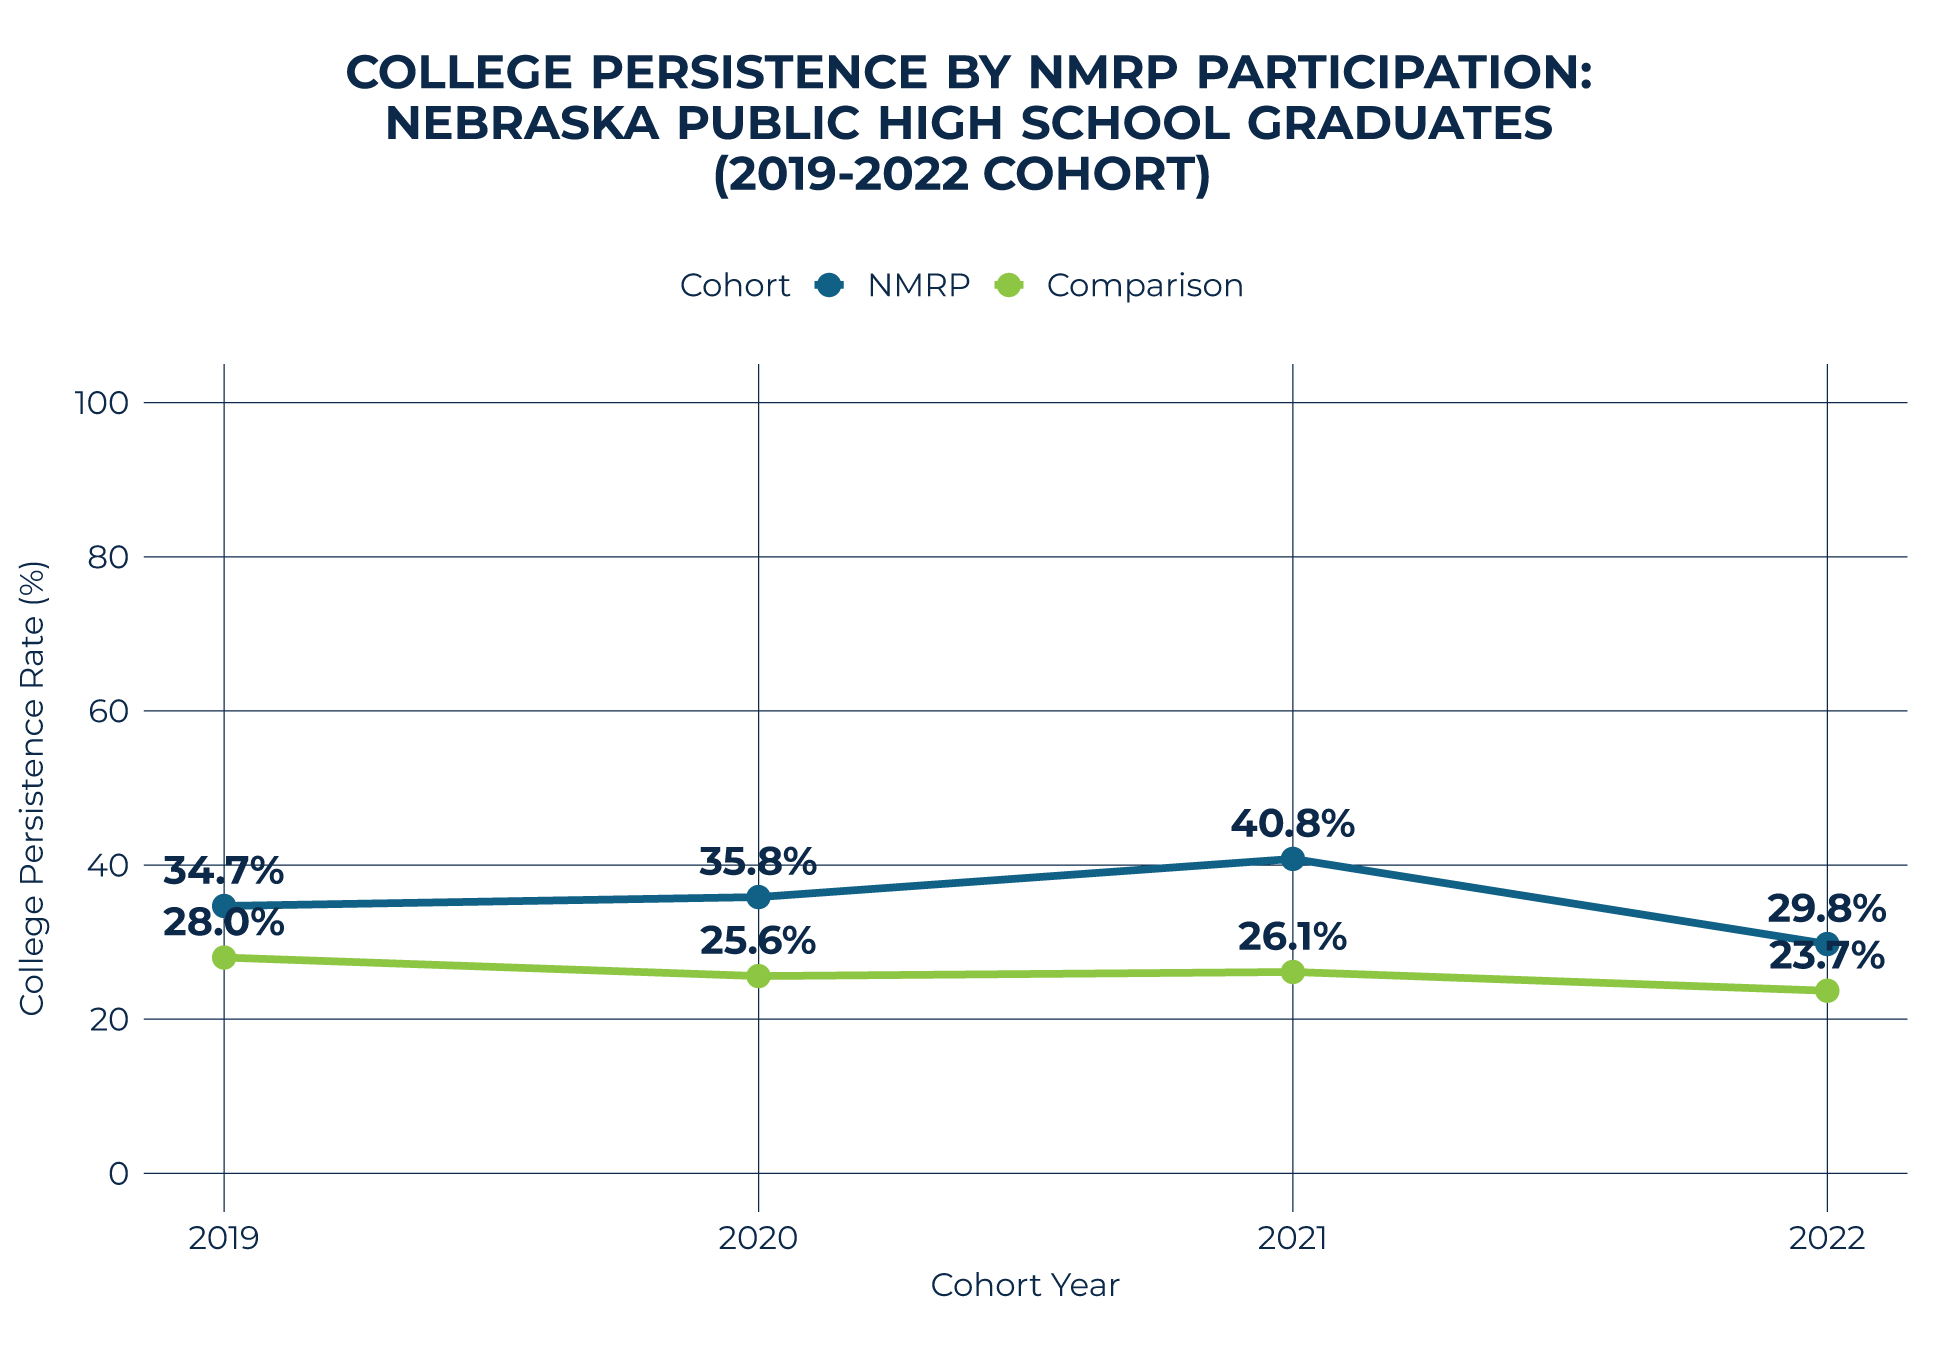
2026 NMRP College Persistence
Nebraska Math Readiness Project participants have higher rates of college persistence than their comparison group. Learn more about NMRP here: https://insights.nswers.org/evaluations/nmrpmcc2026.
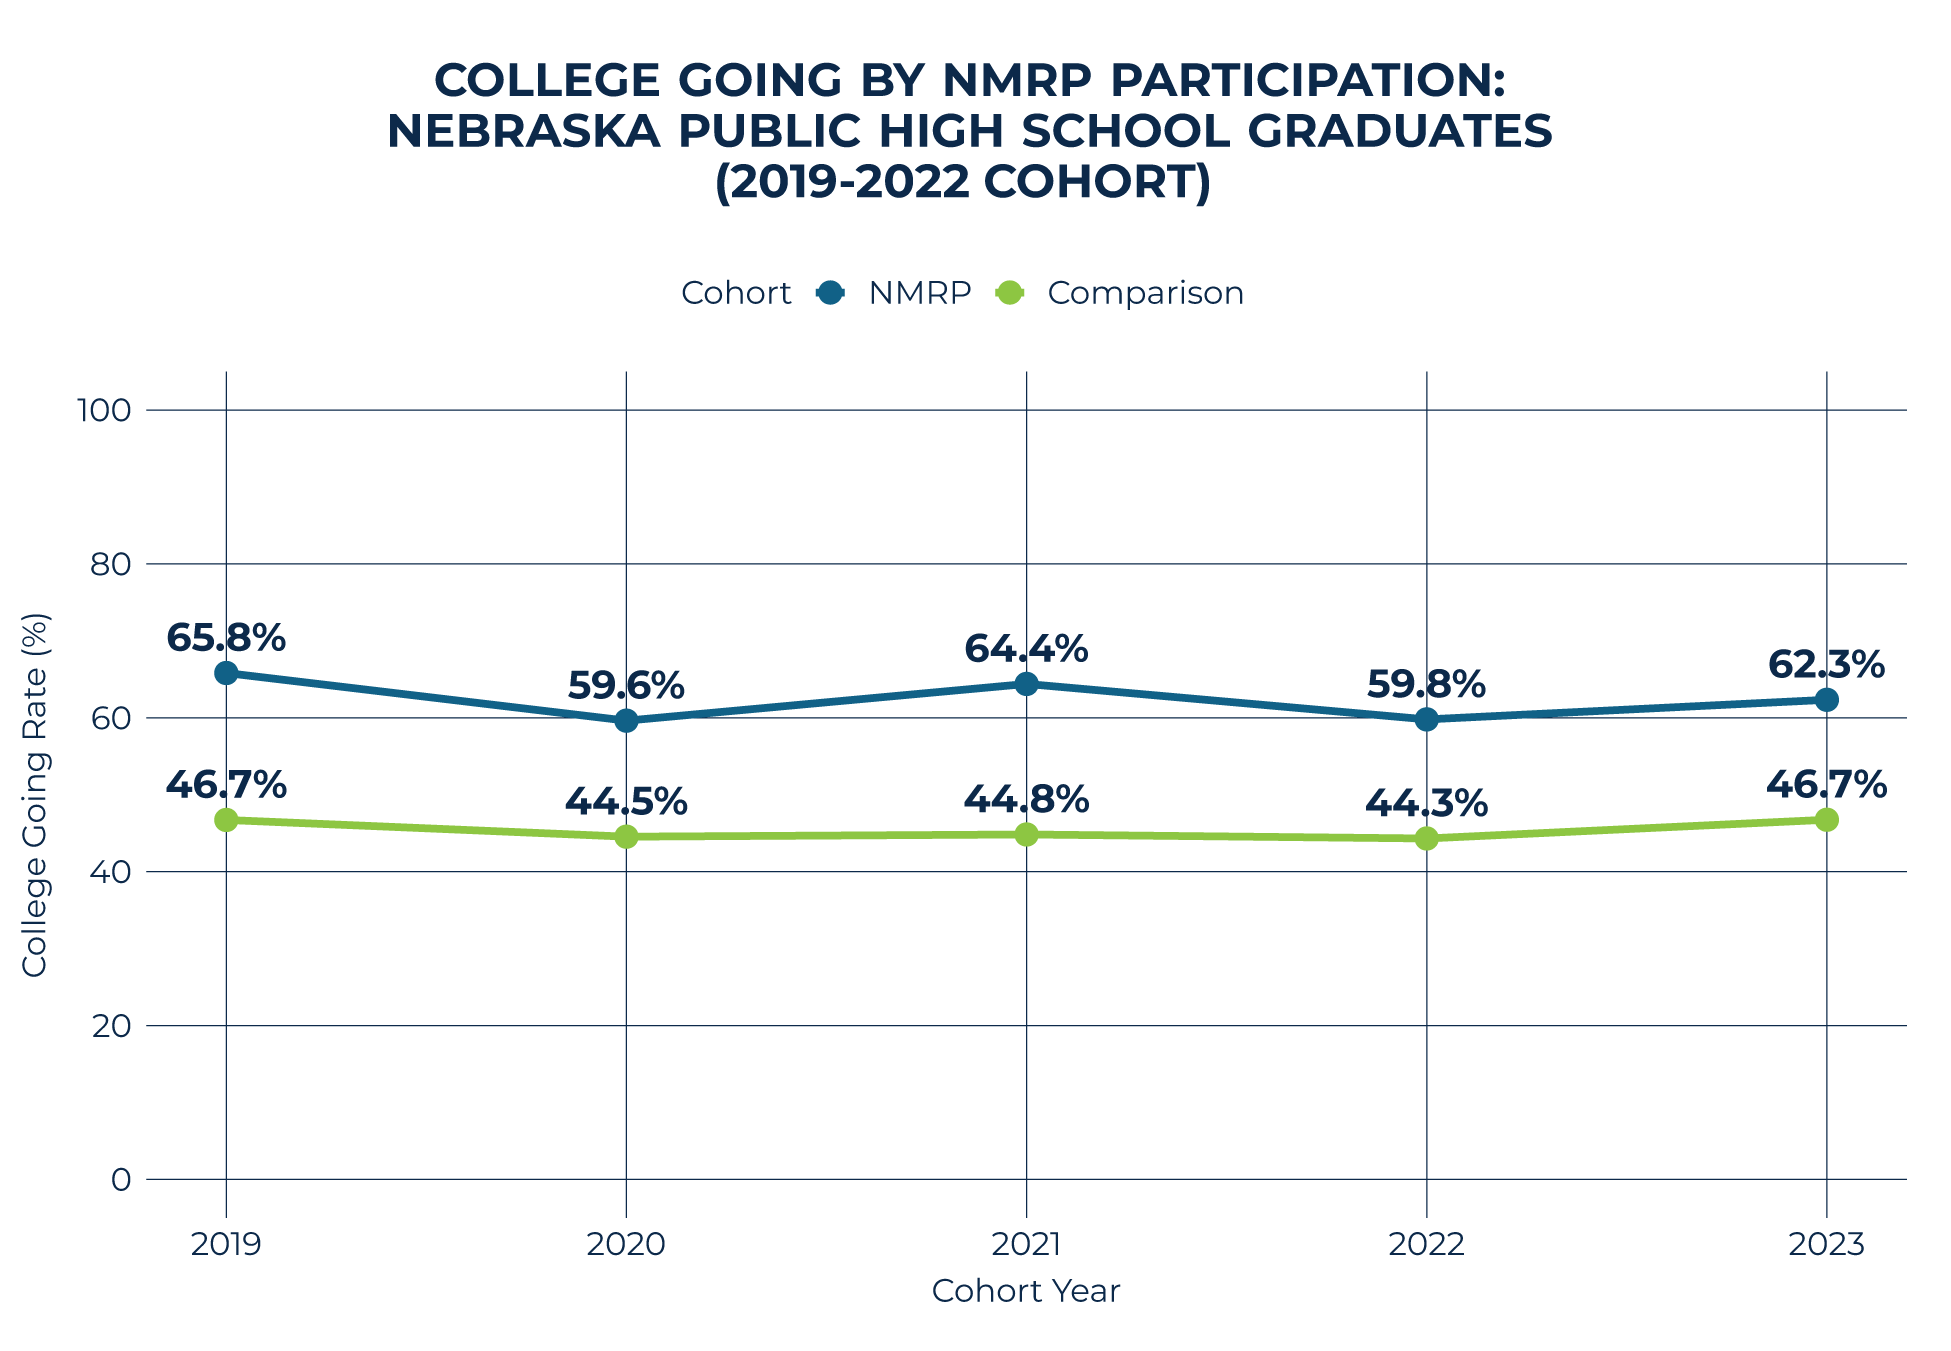
2026 NMRP College Going
Nebraska Math Readiness Project participants consistently demonstrate higher college going rates than their peers. See the additional positive effects of NMRP at: https://insights.nswers.org/evaluations/nmrpmcc2026.
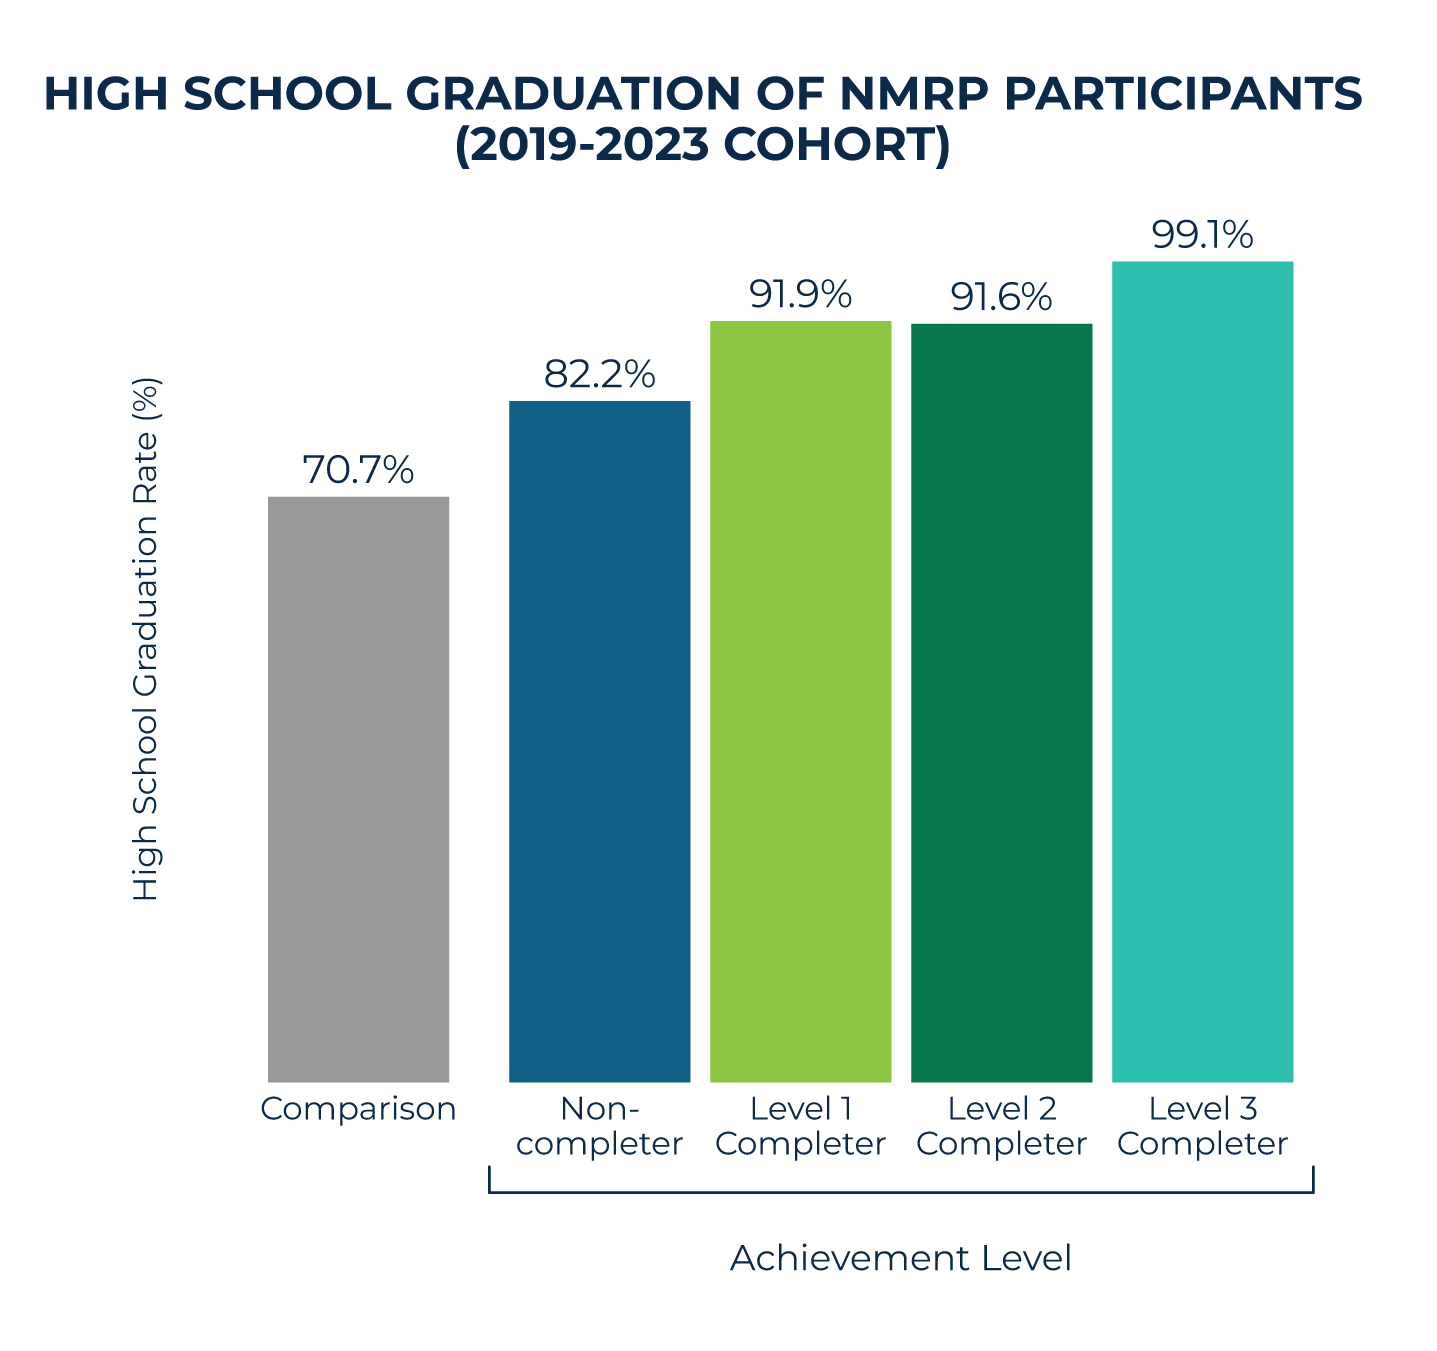
2026 NMRP High School Grad
Higher Nebraska Math Readiness Project achievement levels are associated with higher high school graduation rates (99.1% at Level 3 compared to 70.7% for peers)! Learn more about NMRP: https://insights.nswers.org/evaluations/nmrpmcc2026.
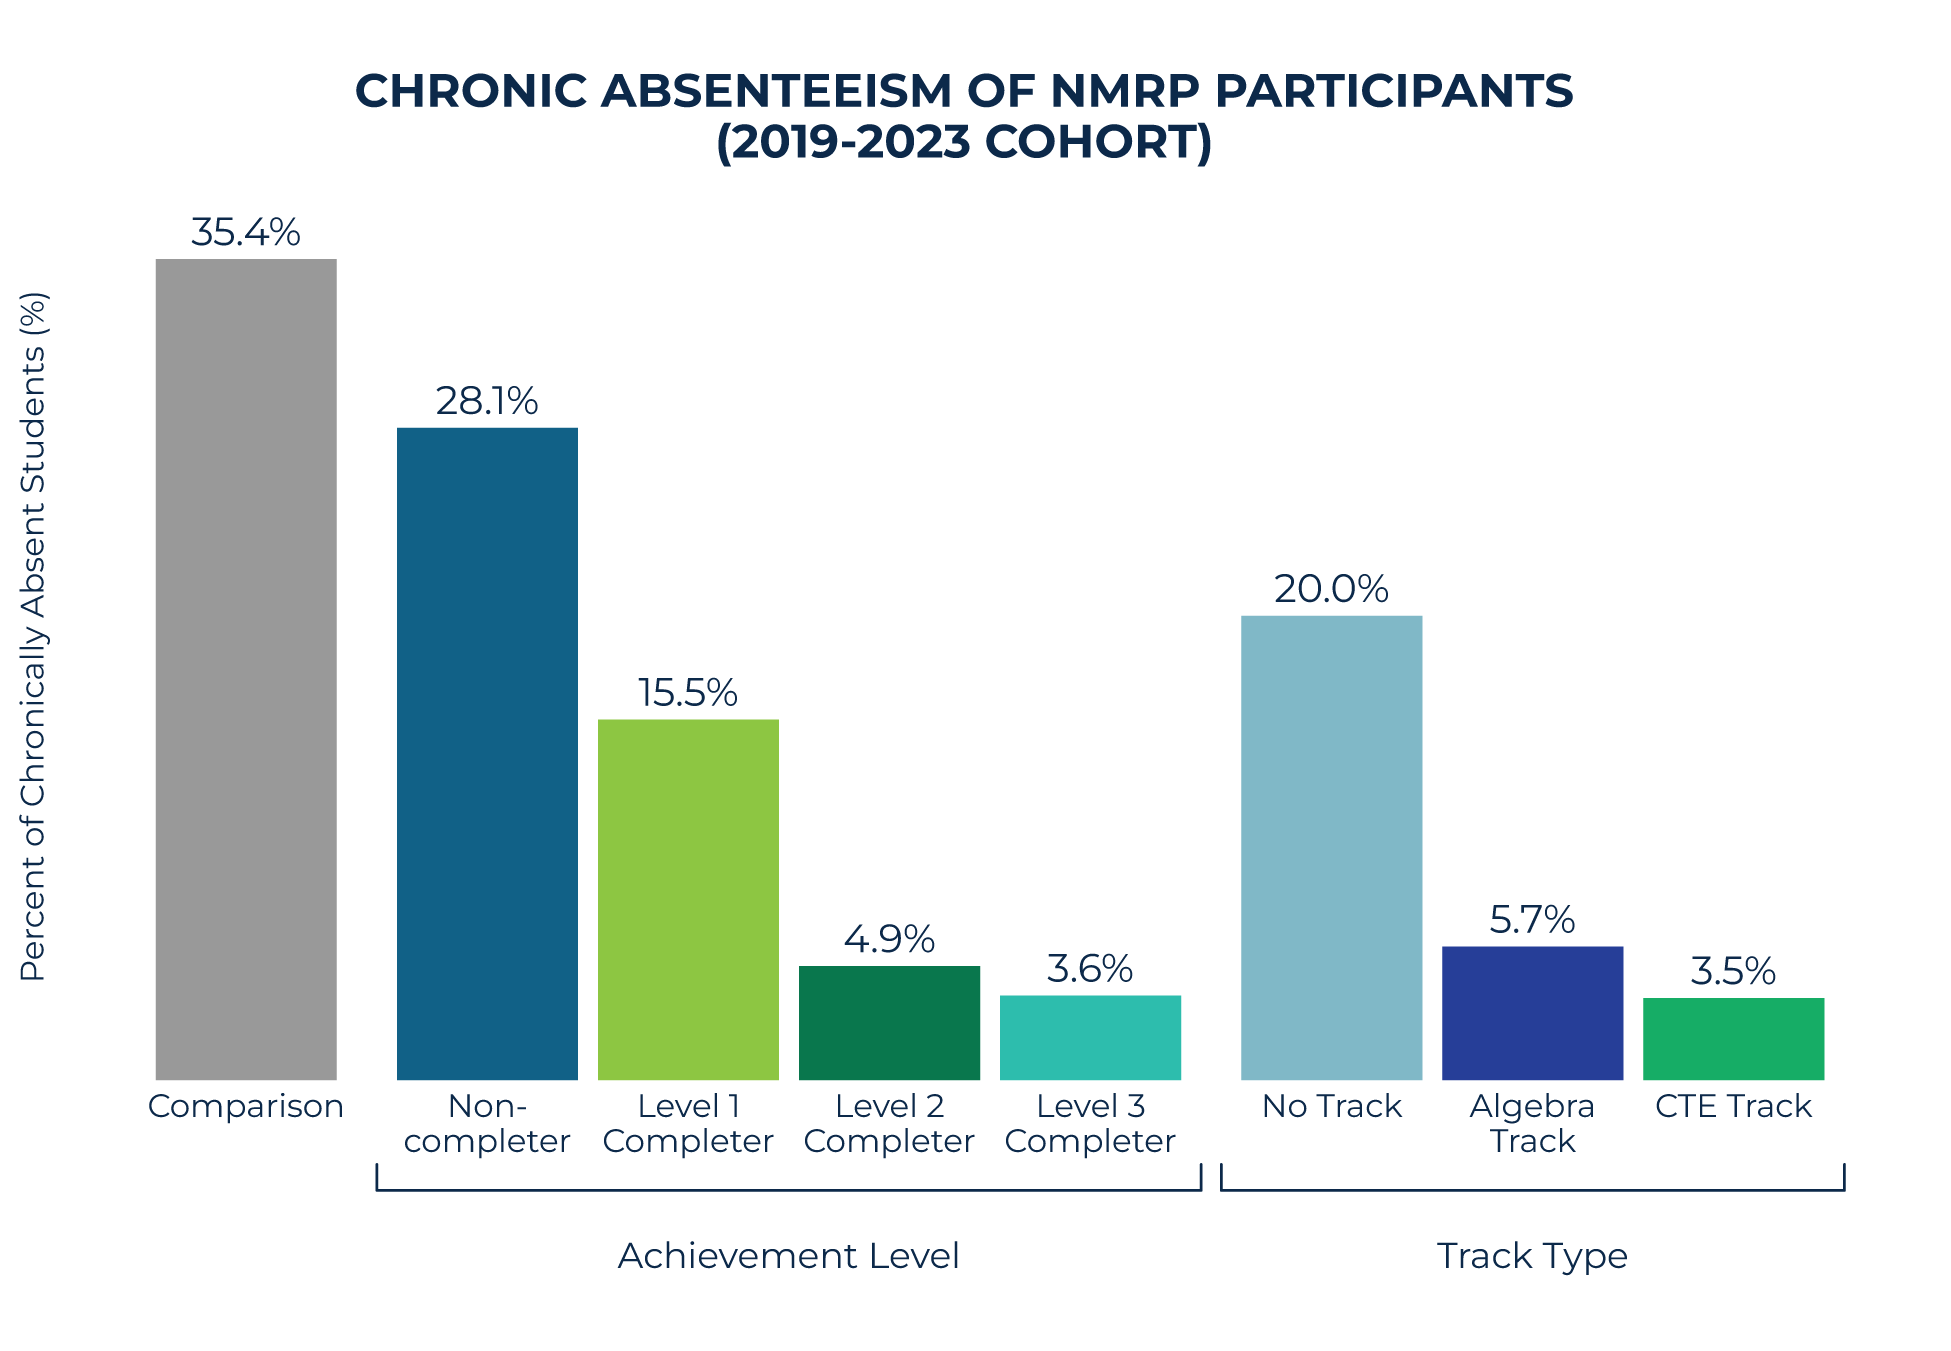
2026 NMRP Track
Higher Nebraska Math Readiness Project achievement levels are associated with lower rates of chronic absenteeism. Students in a CTE track also have a lower percentage of chronic absenteeism (3.5%). To learn more about NMRP visit:...
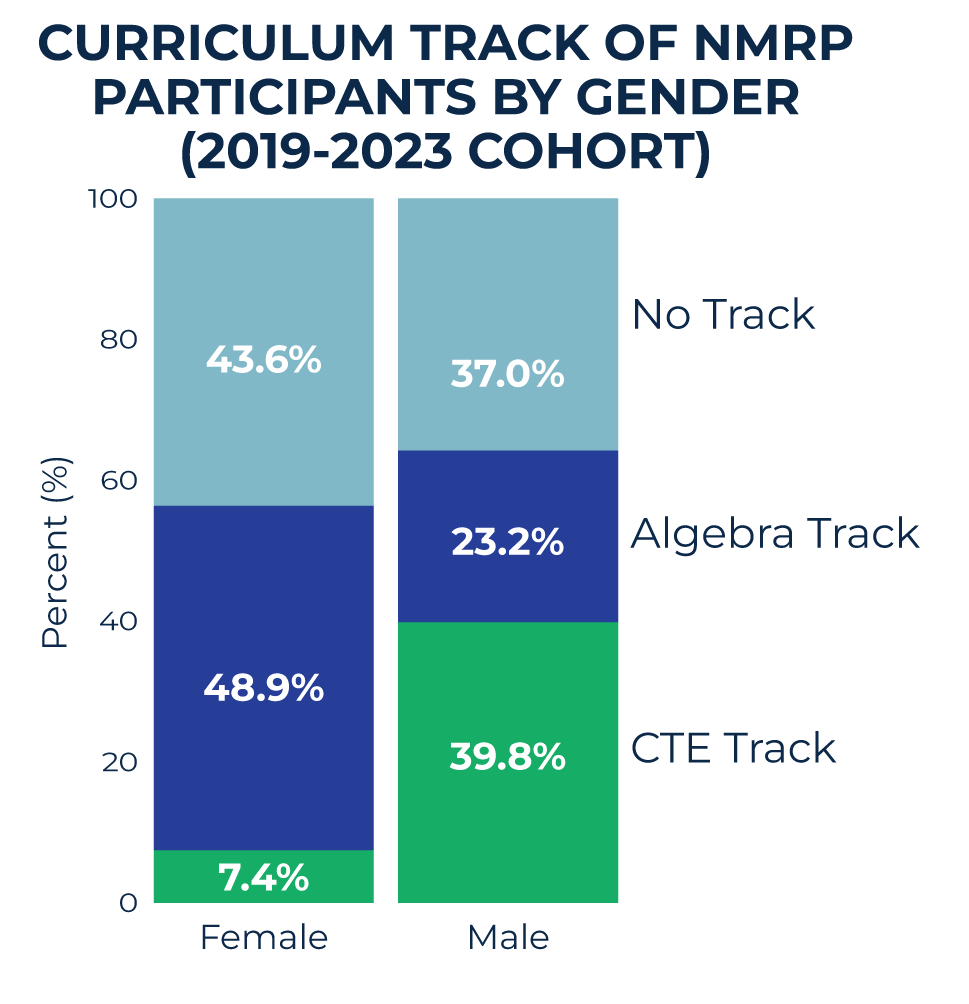
2026 NMRP Gender
Nebraska Math Readiness Project enrollment differs by gender. Male participants select the CTE Track at a much higher rate (40%) than females (7%), while 49% of female participants enroll in the Algebra Track compared to just 23% of males. Learn more:...
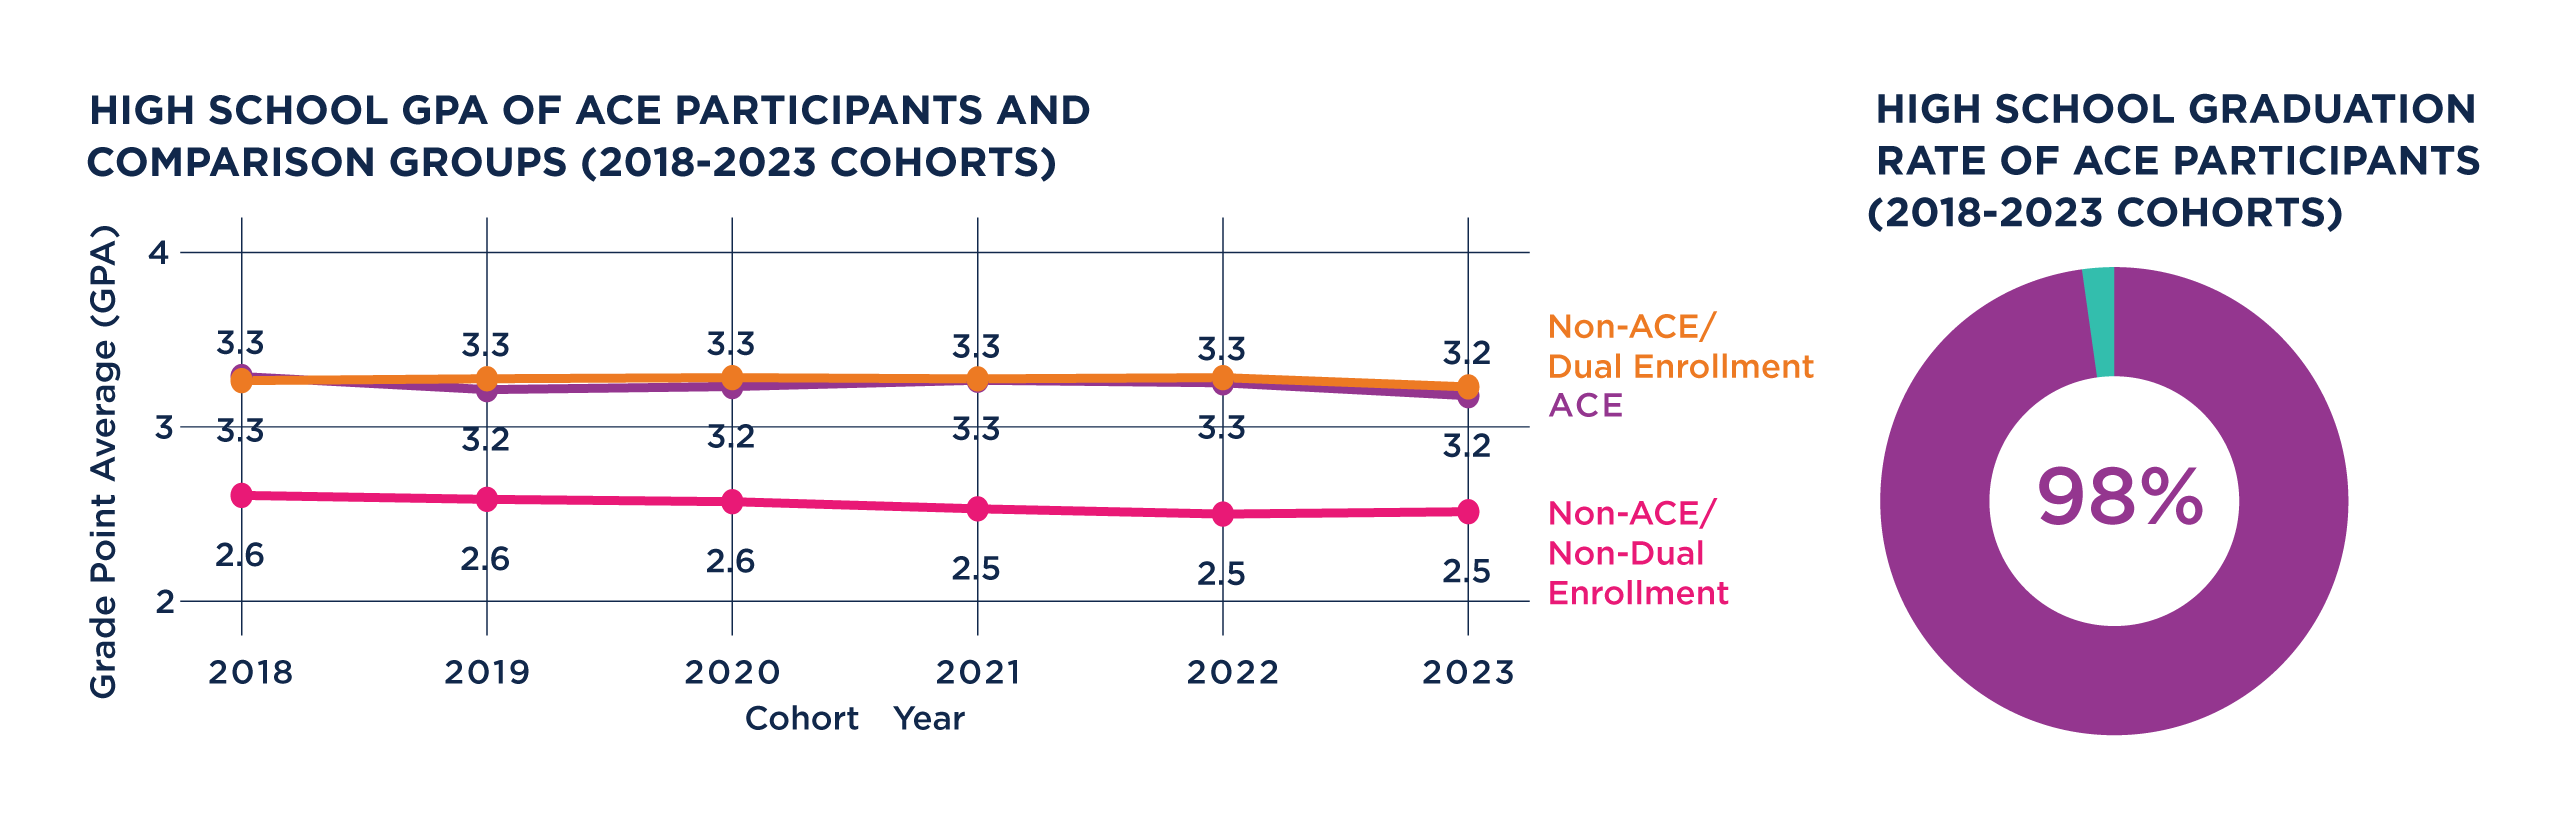
2025 ACE GPAs and Graduation
ACE participants maintain similar GPAs to non‑ACE dual‑enrollment students and higher GPAs than non‑dual‑enrollment students. ACE participants had a high overall high school graduation rate of 98%. Read the ACE report here:...
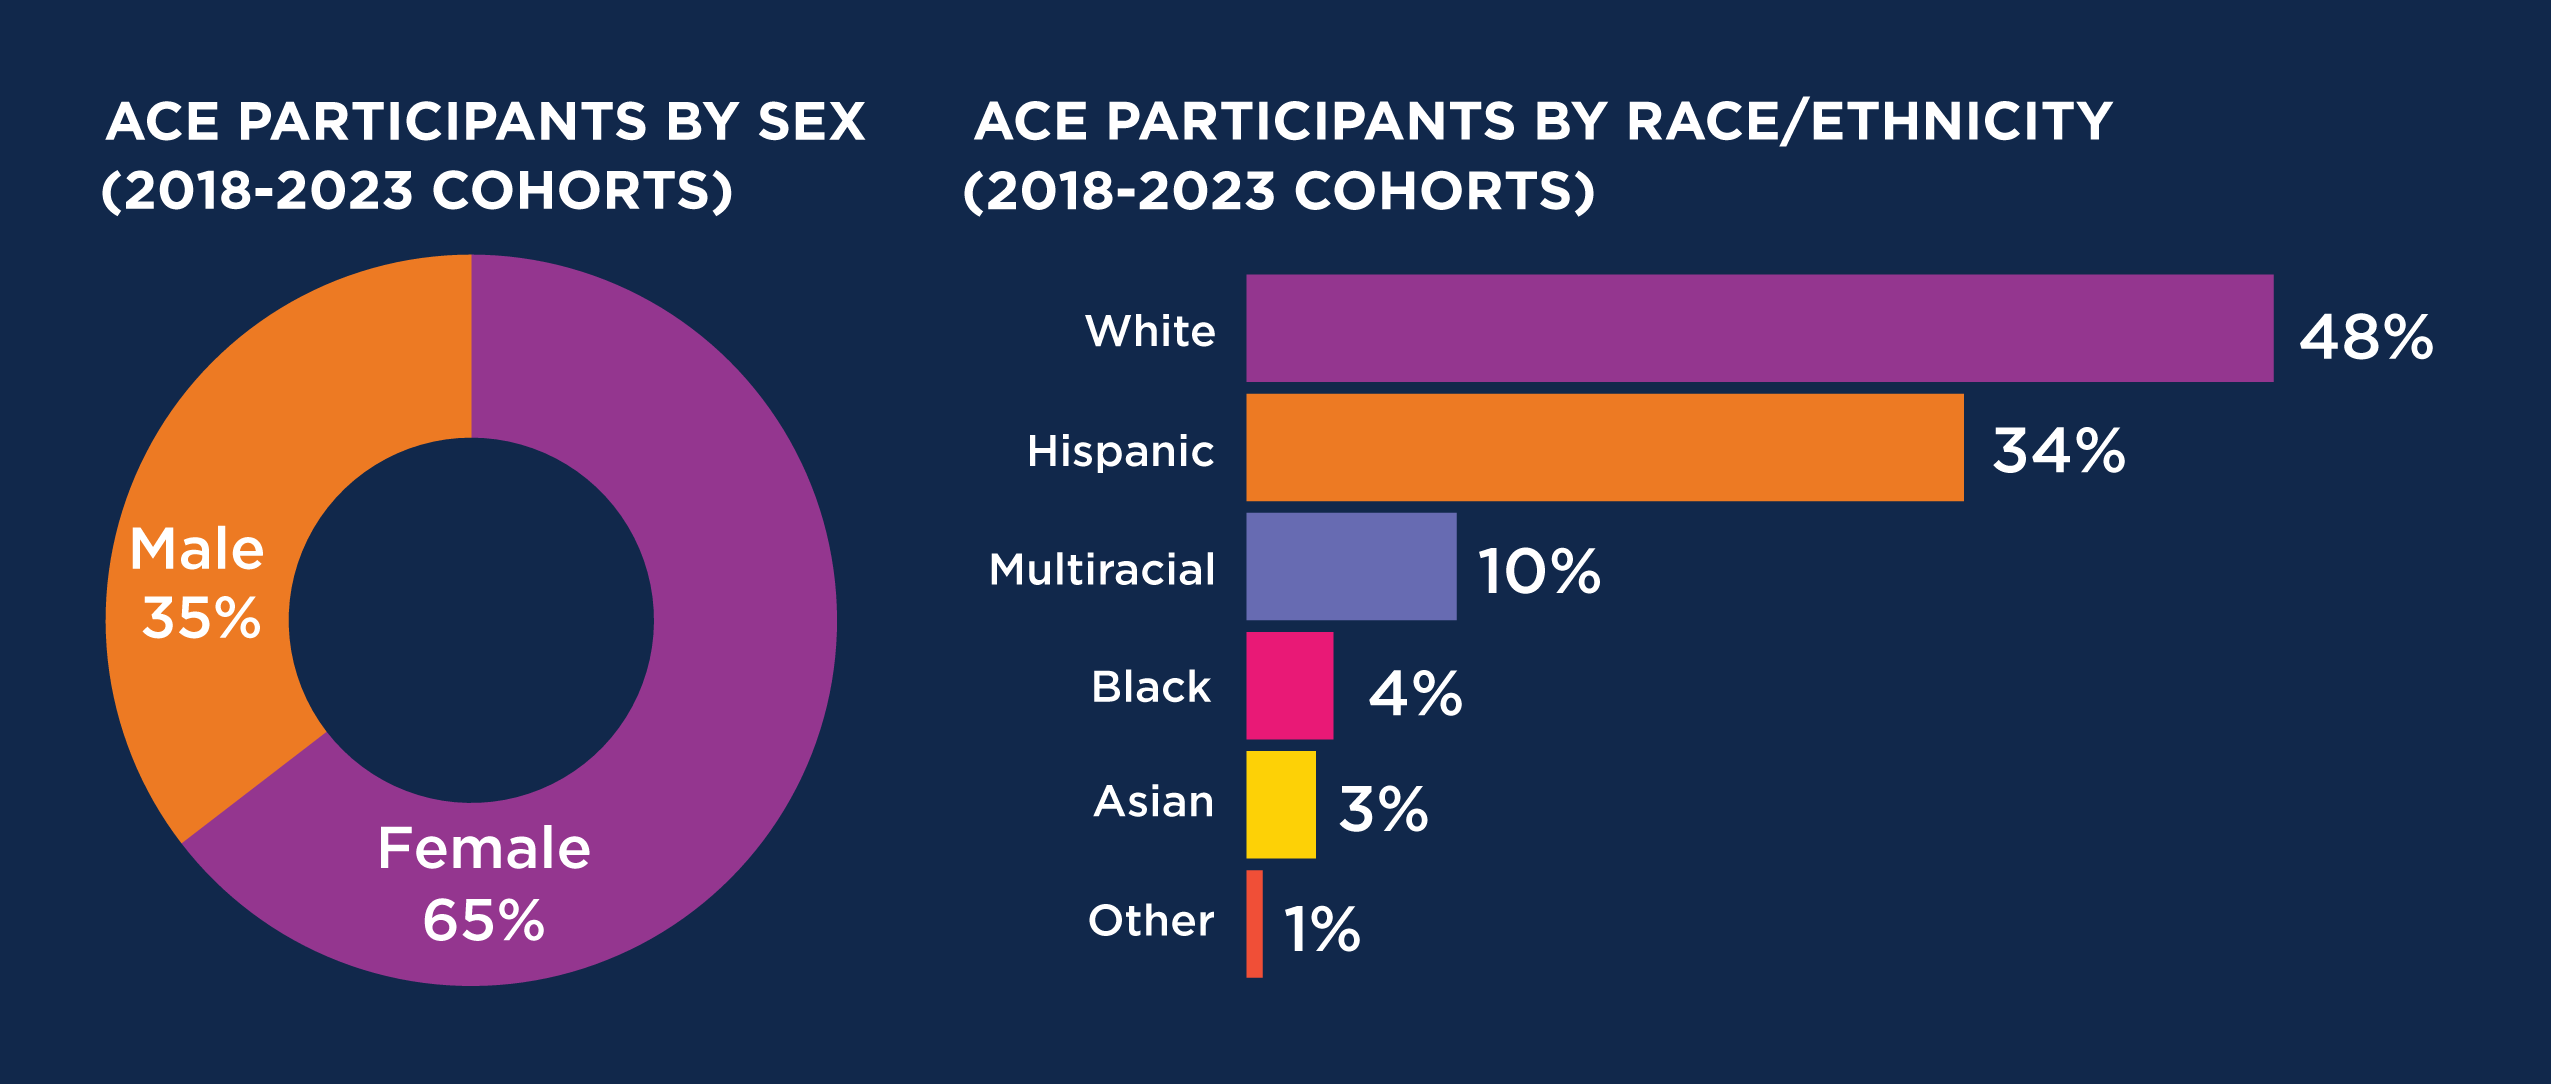
2025 ACE Gender Race
About 65% of Nebraska ACE participants are female. Roughly half of the participants are White, with strong representation from Hispanic students. Read more here: https://insights.nswers.org/evaluations/ace-2025/.

2025 ACE Urban Rural Counties
Did you know more than two‑thirds of ACE scholarship recipients are from urban Nebraska counties? Yet, the participation rate in rural counties is comparatively high given that Nebraska’s youth population is concentrated in urban areas. Read more here:...

2025 ACE Participating Postsecondary
More than half of Nebraska ACE scholarship recipients enroll in dual enrollment courses through community colleges. For more about Nebraska ACE scholars, read the program evaluation here: https://insights.nswers.org/evaluations/ace-2025/.
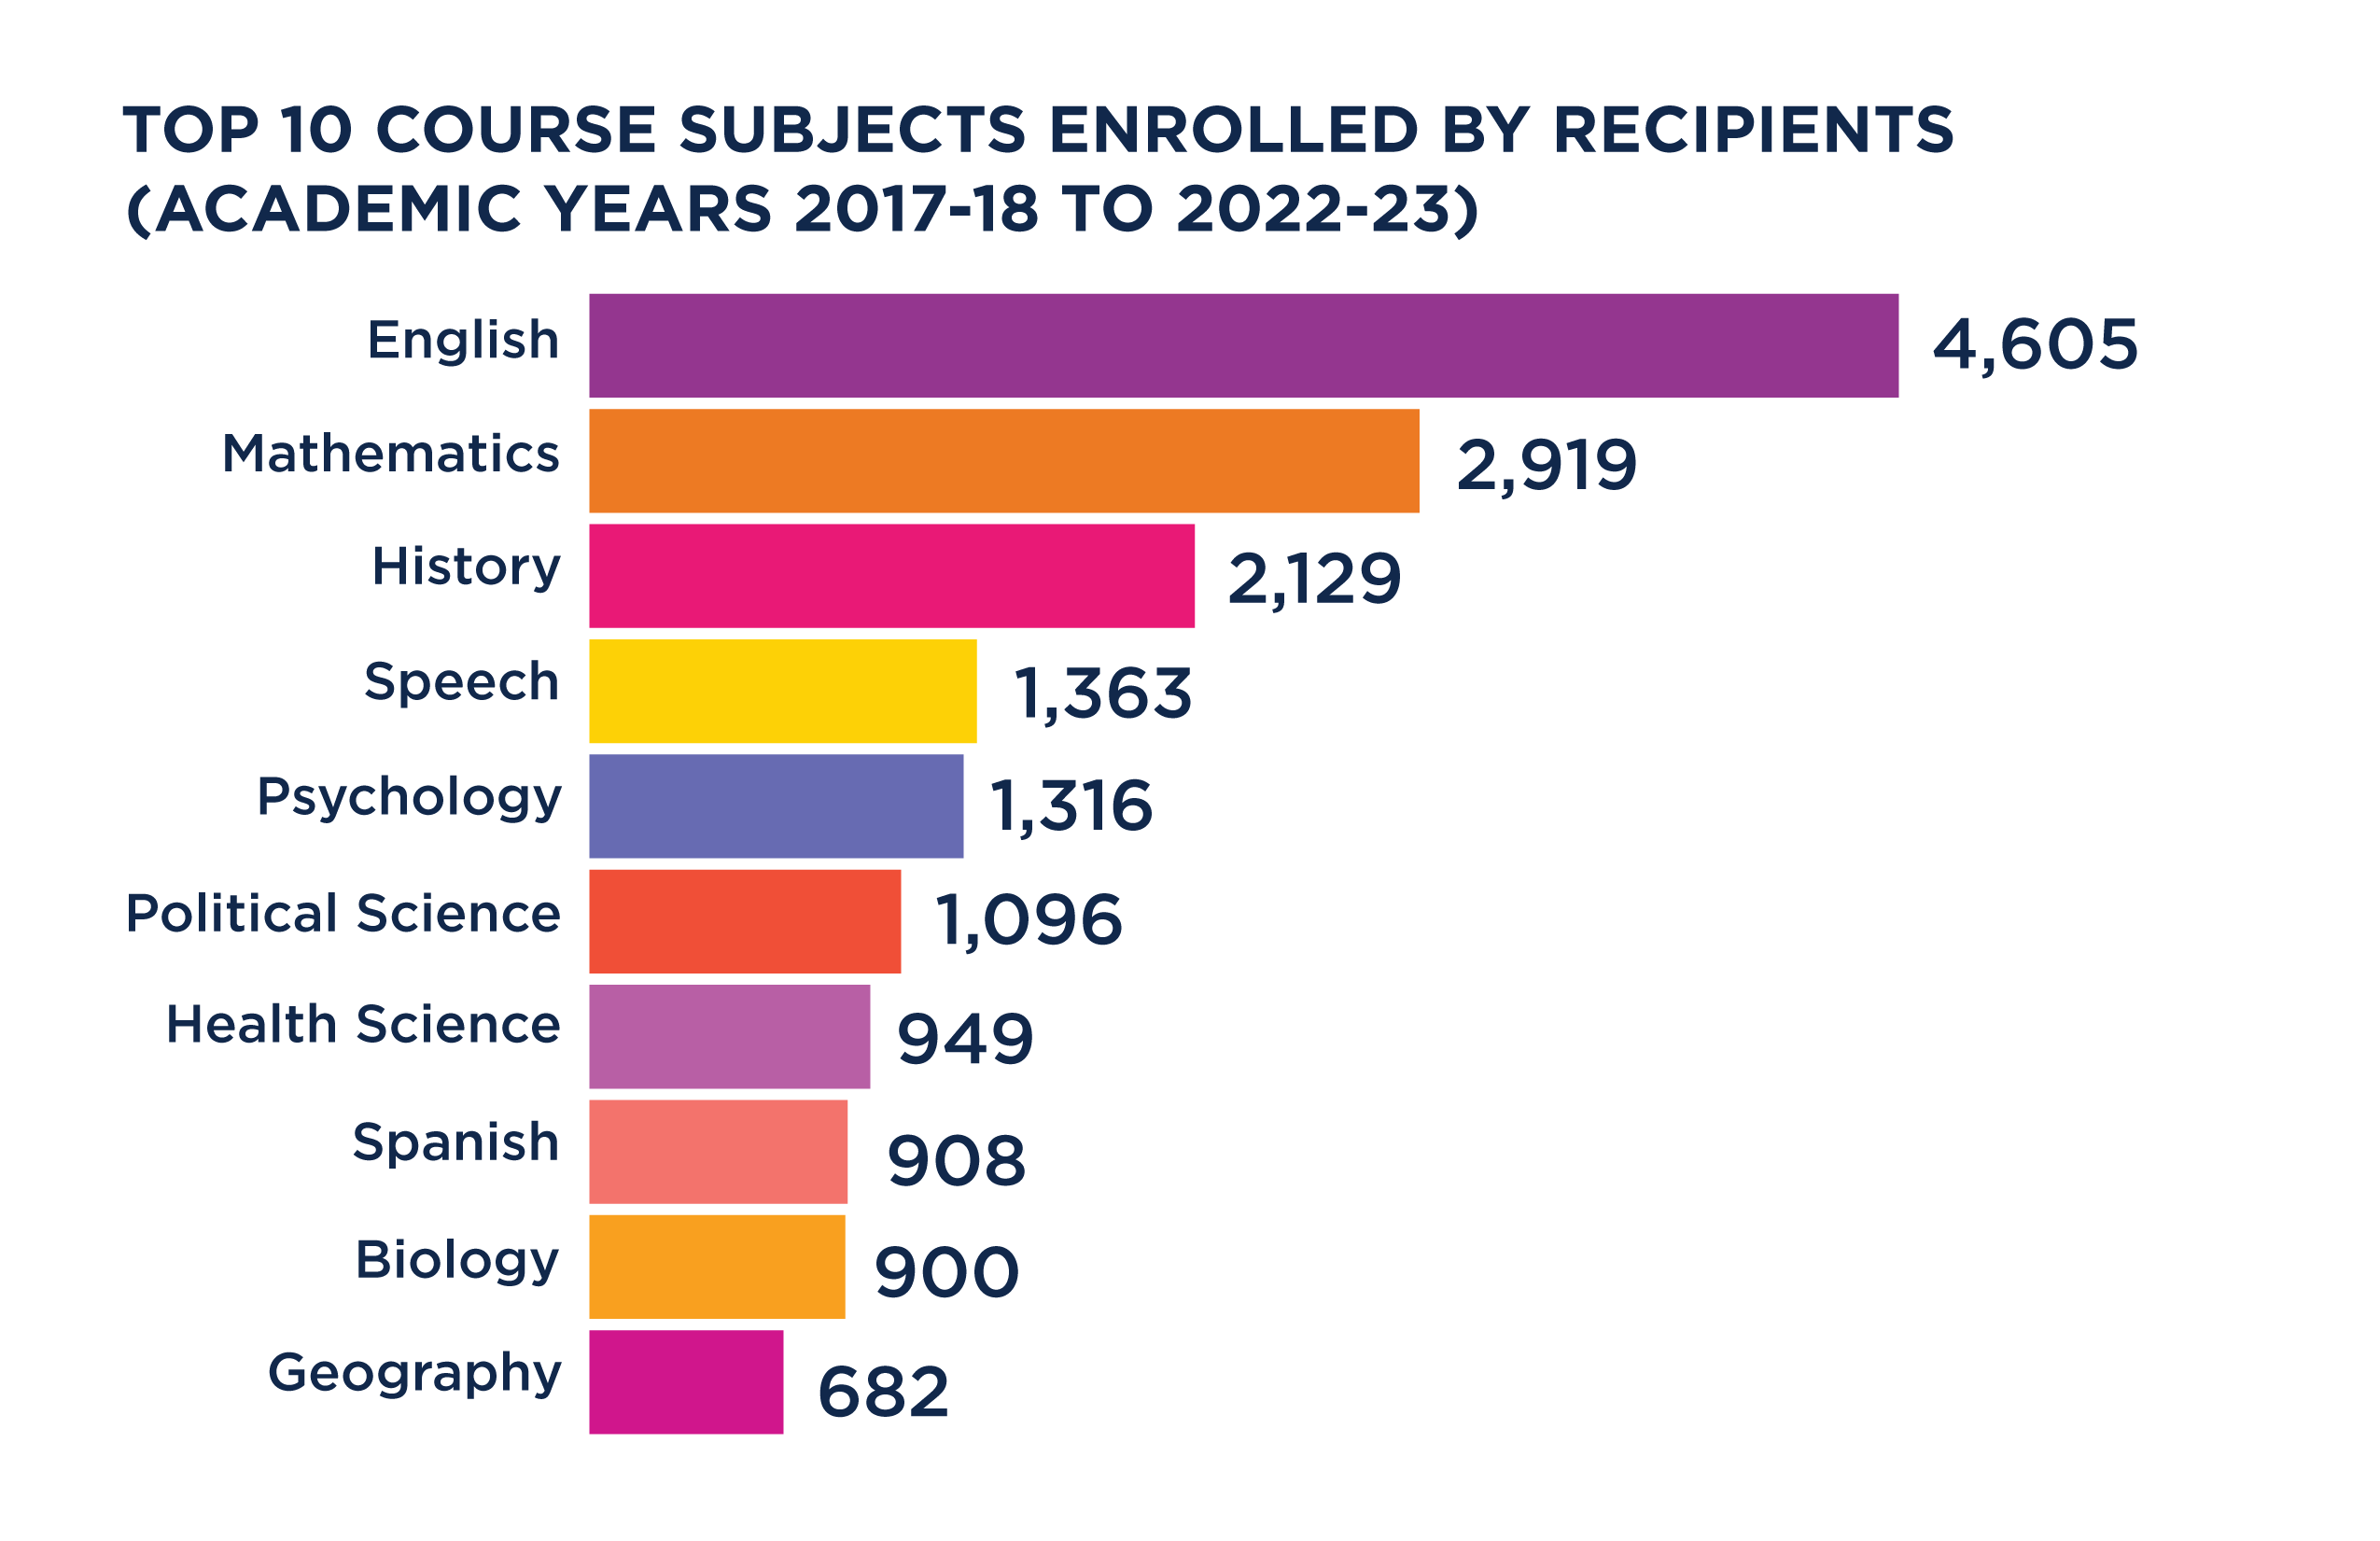
2025 ACE Top 10 Courses
The total number of courses enrolled in and completed by Nebraska ACE scholarship recipients has increased over time. English was the most frequently enrolled subject, followed by mathematics and history. Read more about the ACE scholars:...
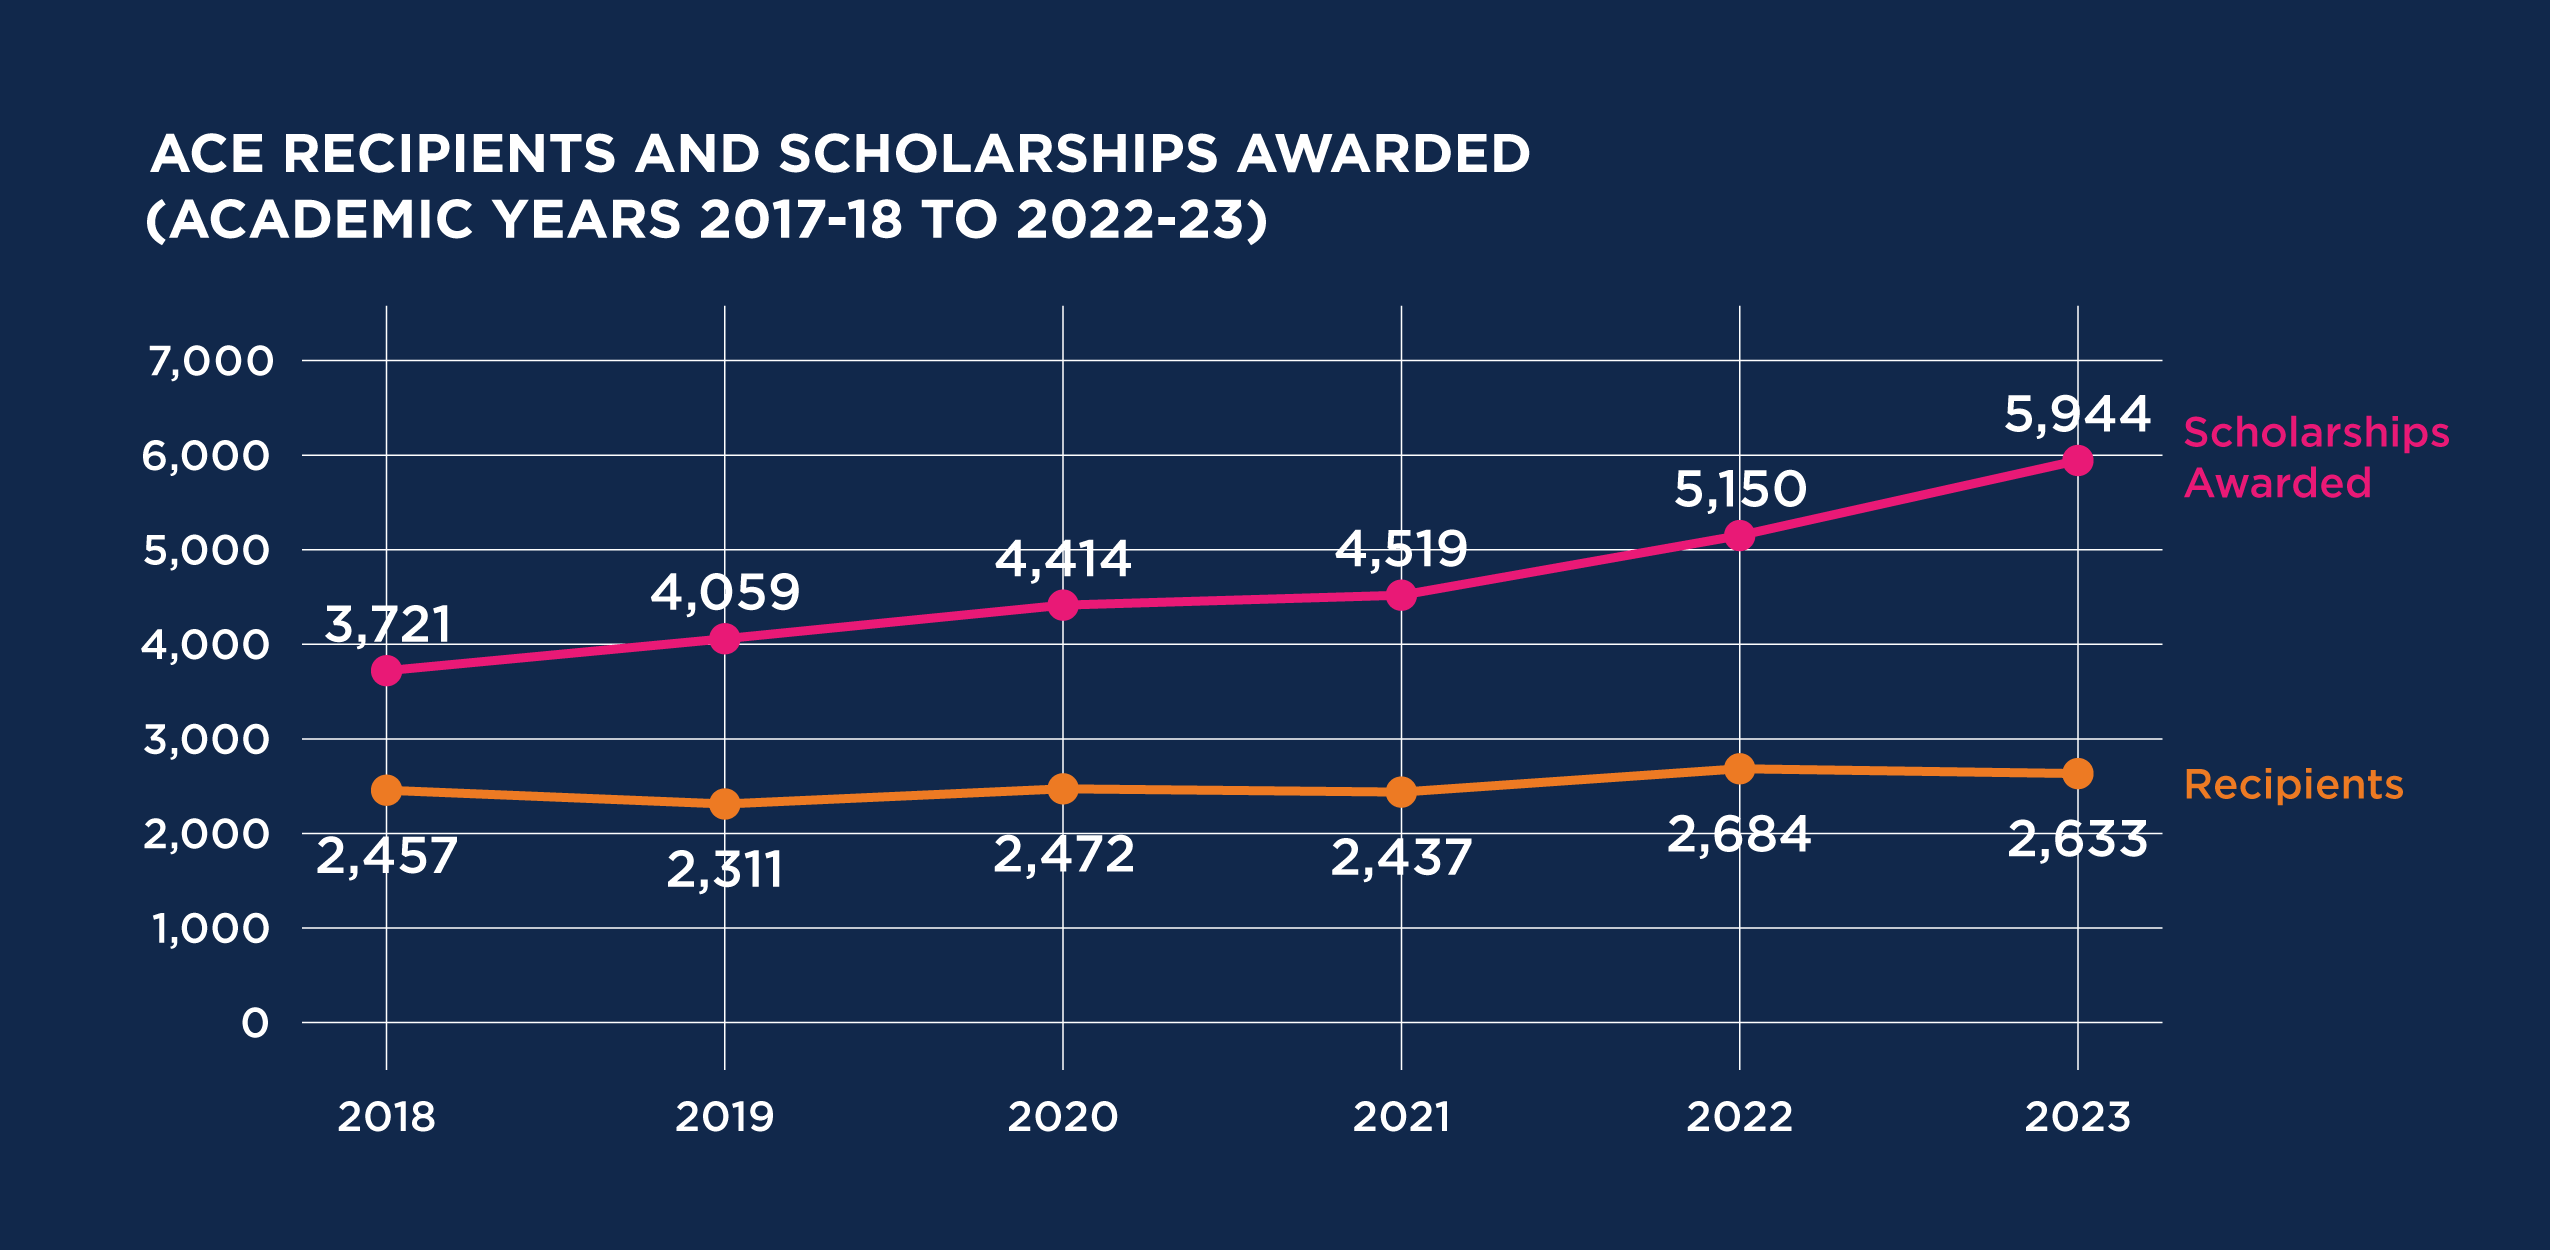
2025 ACE Recipients and Scholarships
The number of Nebraska ACE scholarships awarded has increased steadily over time, while the number of ACE scholarship recipients has remained relatively constant. Read the full report on ACE scholars here: https://insights.nswers.org/evaluations/ace-2025/.
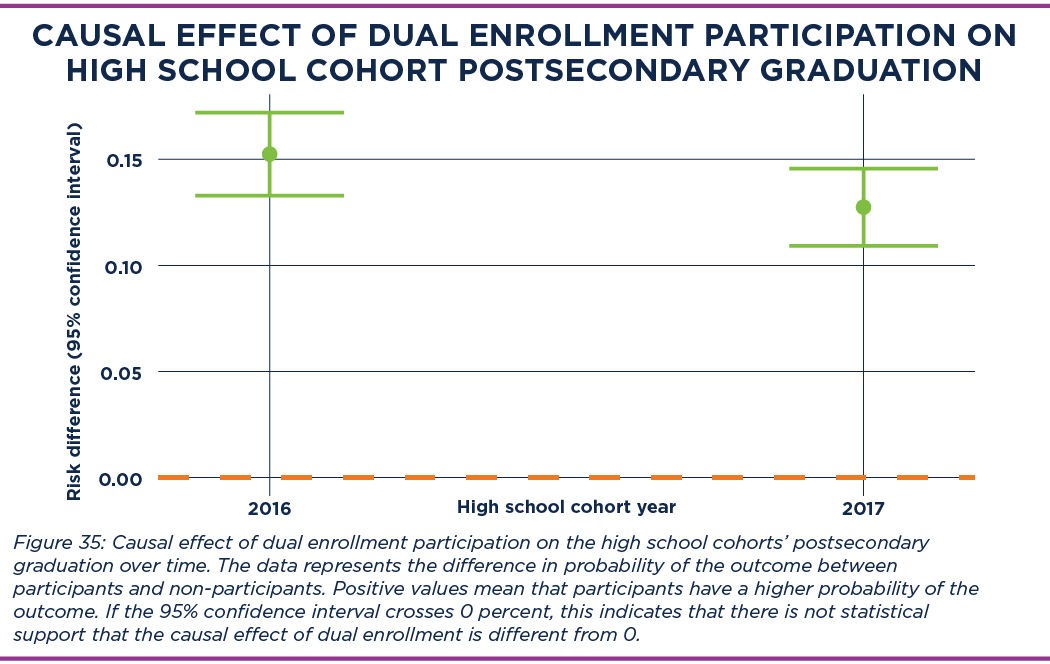
Causal Effect of Dual Enrollment Participation on Postsecondary Graduation 2025
Dual enrollment participants in Nebraska are 13 percentage points more likely to attain a postsecondary degree within six years of high school graduation than those who do not participate. Read more about dual enrollment in Nebraska:...
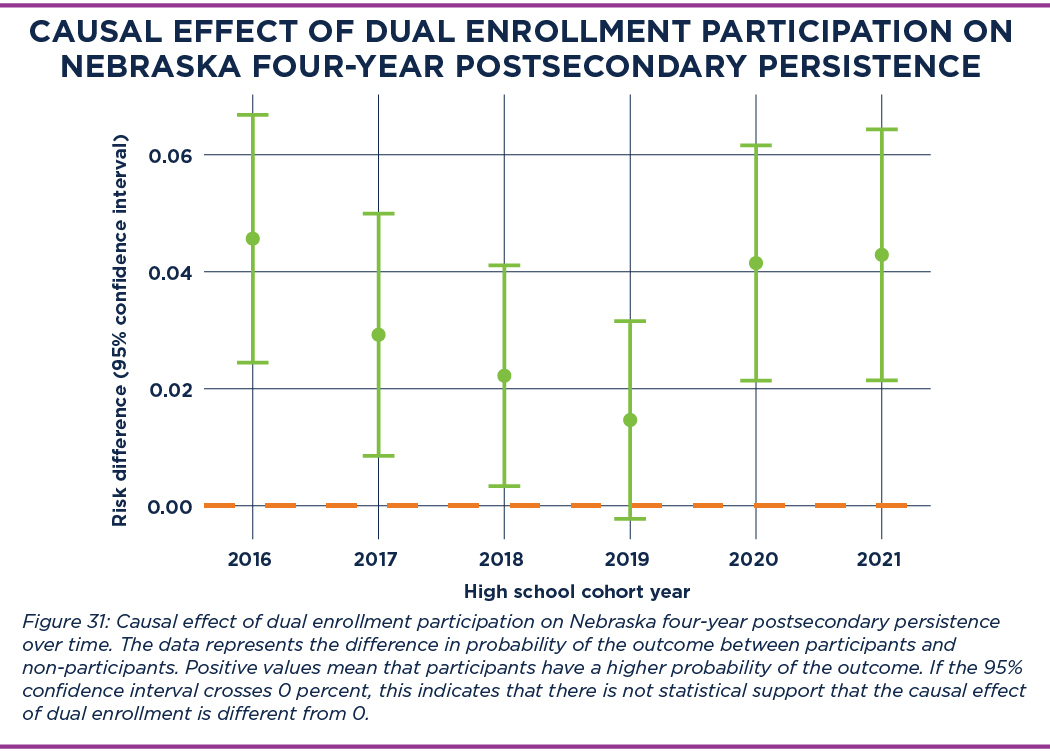
Causal Effect of Dual Enrollment Participation on Nebraska Four-year Postsecondary Persistence 2025
At four-year Nebraska-based institutions, college persistence rates were four percentage points higher for those who participated in dual enrollment than those who did not. Learn more about dual enrollment in Nebraska:...
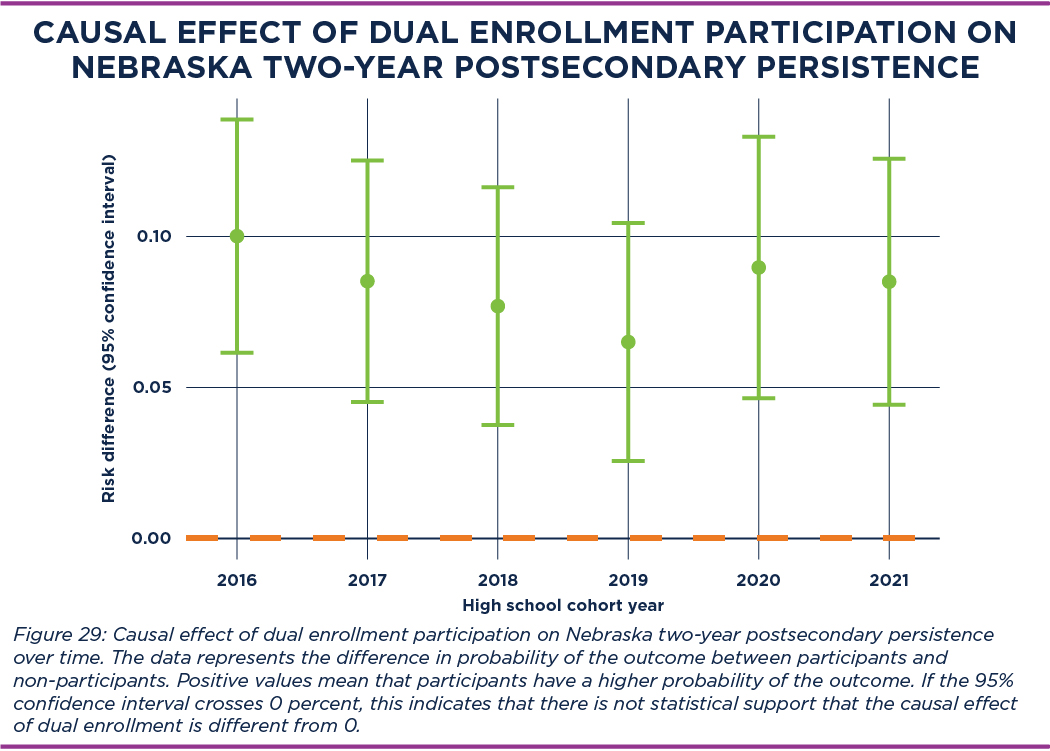
Causal Effect of Dual Enrollment Participation on Nebraska Two-Year Postsecondary Persistence 2025
College persistence rates are greater at Nebraska-based institutions for those who participated in dual enrollment than those who did not. In fact, 9 percentage points higher at two-year colleges! Read more:...
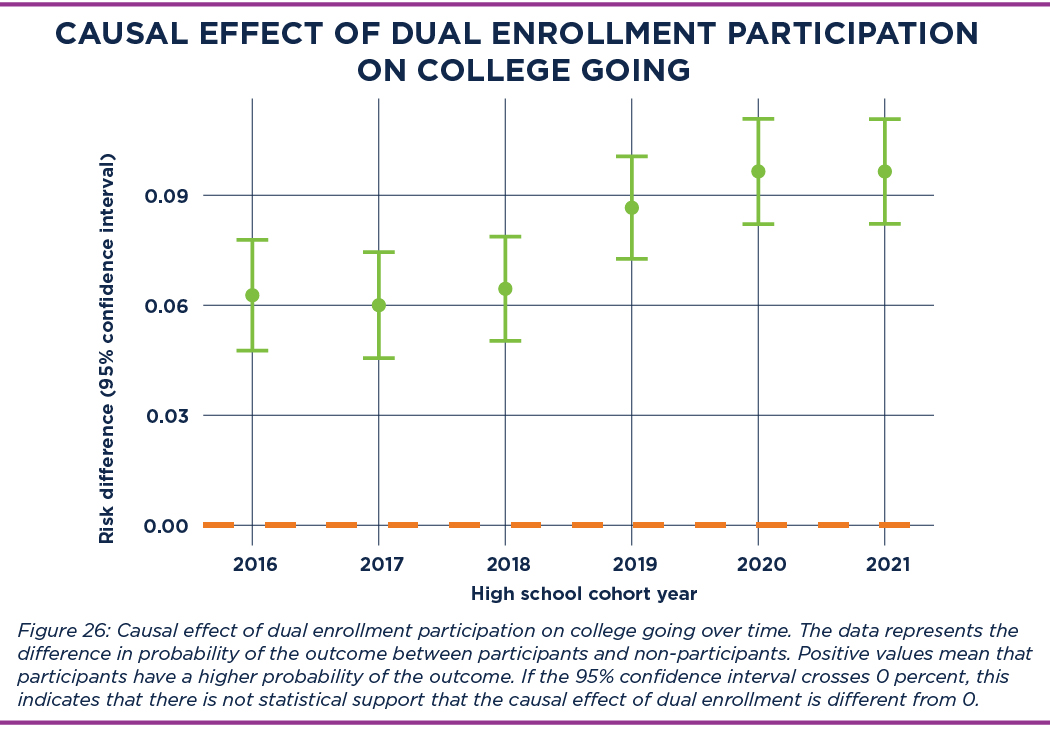
Causal Effect of Dual Enrollment Participation on College Going 2025
Nebraska dual enrollment participants are 10 percentage points more likely to enroll in college within 16 months of high school graduation than those who do not participate. Read more about dual enrollment in Nebraska:...
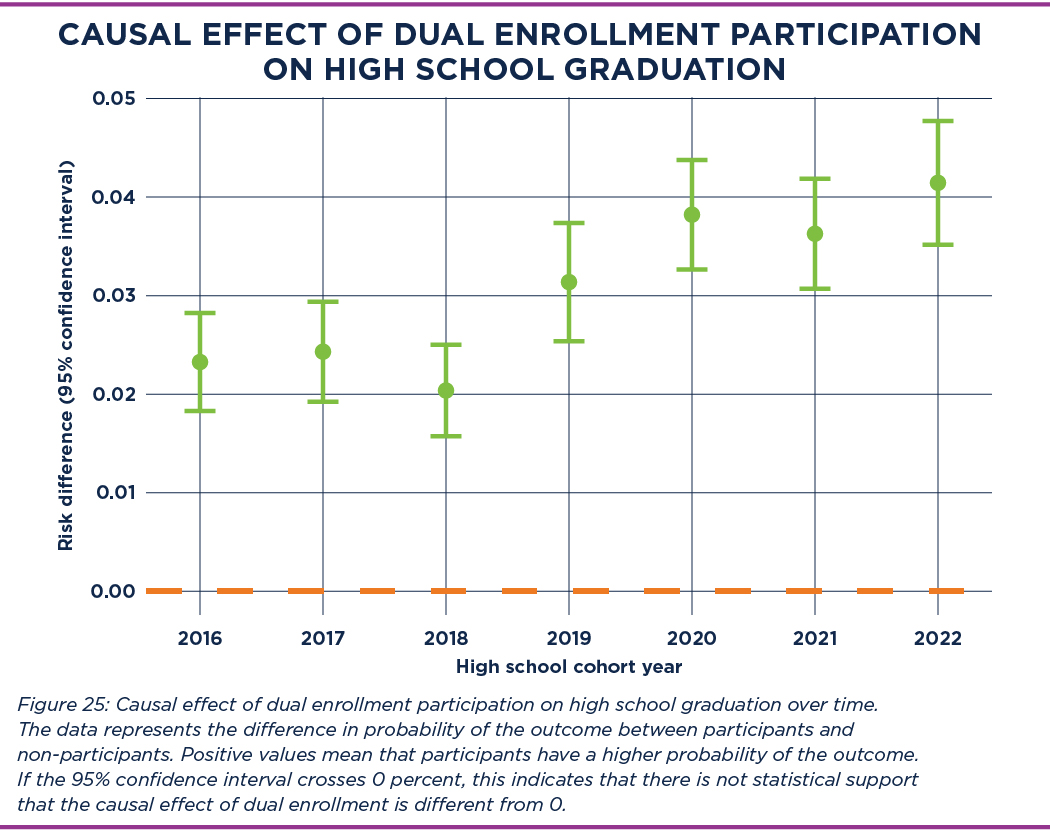
Causal Effect of Dual Enrollment Participation on High School Graduation 2025
Dual enrollment participants in Nebraska are four percentage points more likely to graduate high school on time than non-participants. Read more about dual enrollment in Nebraska: https://insights.nswers.org/special-report/2025-dual-enrollment.pdf.
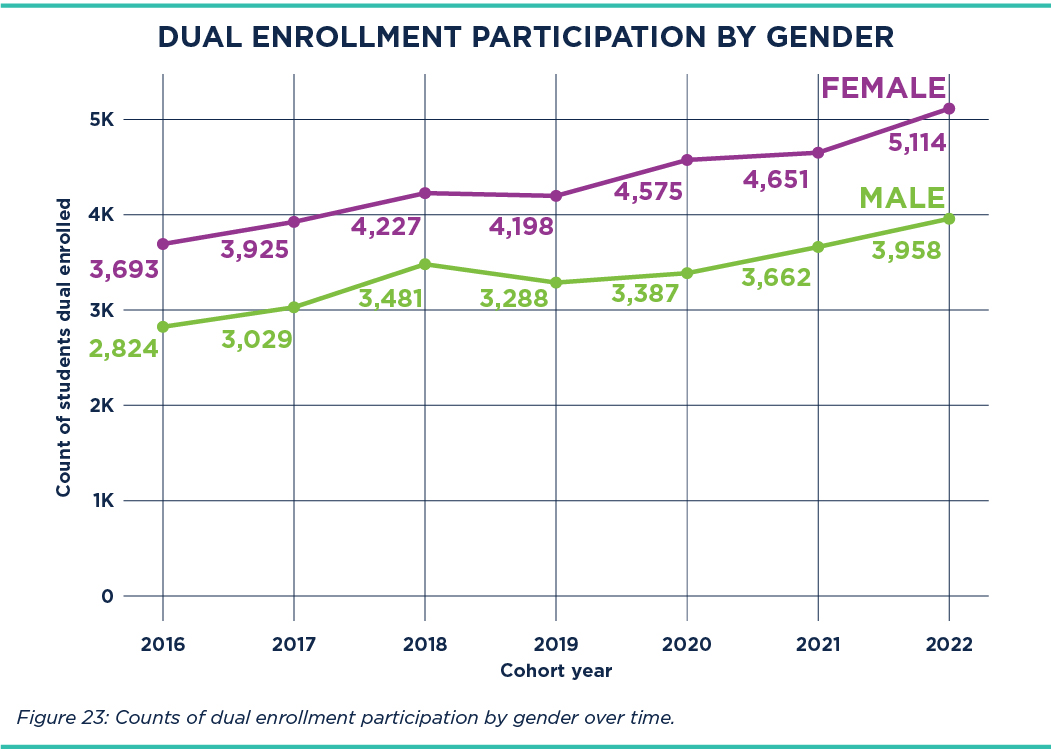
Dual Enrollment Participation by Gender 2025
Female students are more likely to participate in dual enrollment in Nebraska than male students (56% versus 44%) and this gender gap continues over time. Read more about dual enrollment in Nebraska: https://insights.nswers.org/special-report/2025-dual-enrollment.pdf.
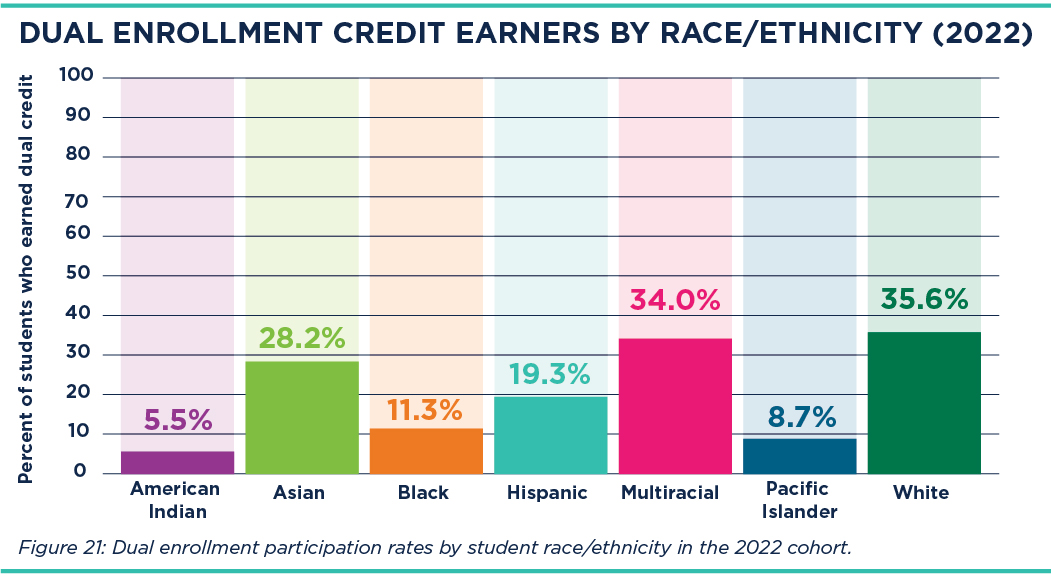
Dual Enrollment Credit Earners by Race/Ethnicity 2025
White students had the highest dual enrollment participation rate in Nebraska (over 35%), while Hispanic (19%) and Black students (11%) participated at lower rates. To learn more about dual enrollment in Nebraska, visit:...
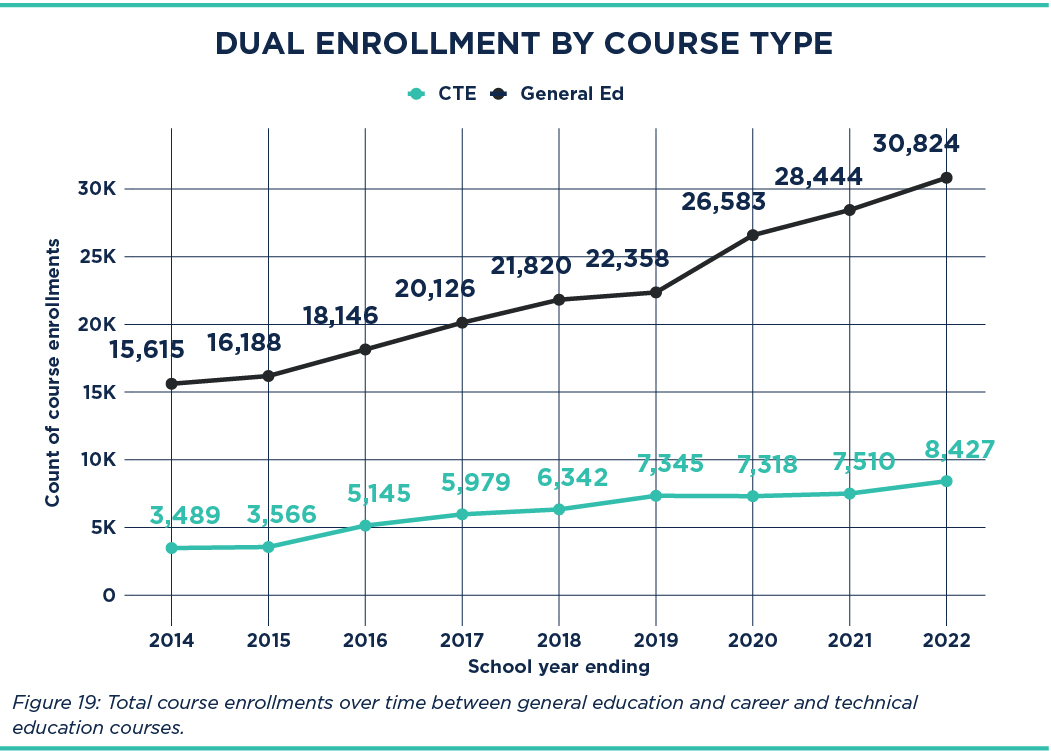
Dual Enrollment by Course Type 2025
Career and Technical Education (CTE) courses make up 22% of the total courses taken by Nebraska dual enrollment participants in the 2022 cohort. Both general education & CTE courses have increased over time. Read more:...

Median First Year Postsecondary GPA Dual Enrollment 2025
First-year postsecondary college GPAs are higher among dual enrollment participants than non-participants at both two- and four-year Nebraska colleges. Read more about dual enrollment in Nebraska: https://insights.nswers.org/special-report/2025-dual-enrollment.pdf.
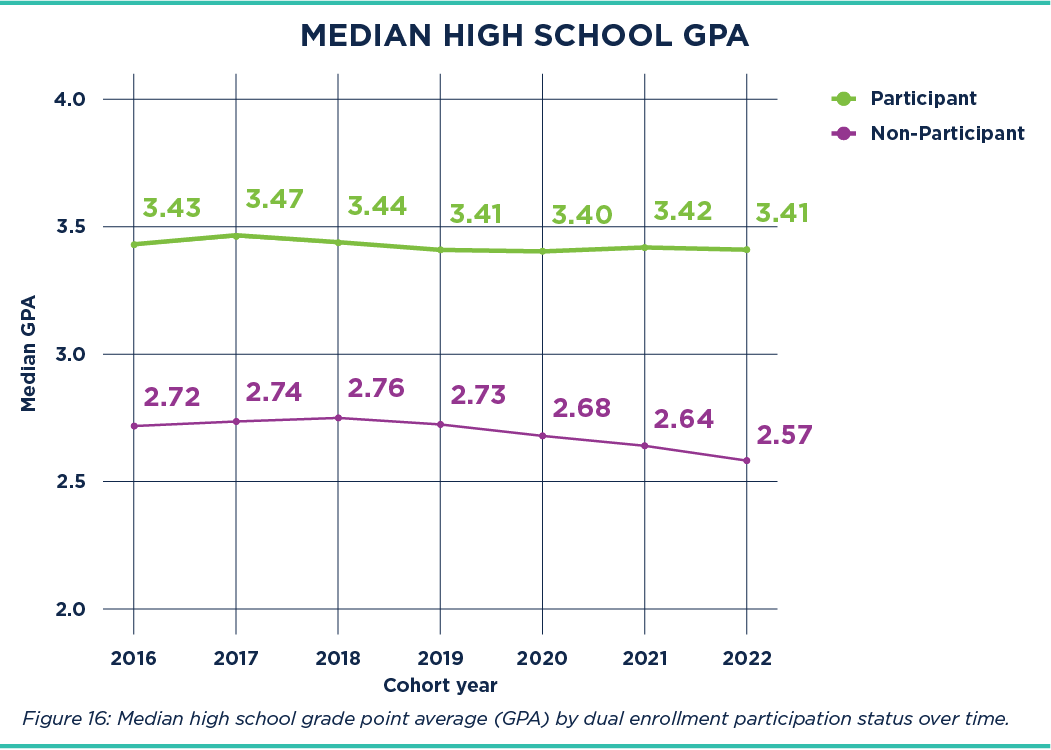
Dual Enrollment Median High School GPA 2025
The median high school GPA among Nebraska dual enrollment participants is 3.41, which is higher than among non-dual enrollees who earned 2.57 in the 2022 cohort. Read more about dual enrollment in Nebraska:...
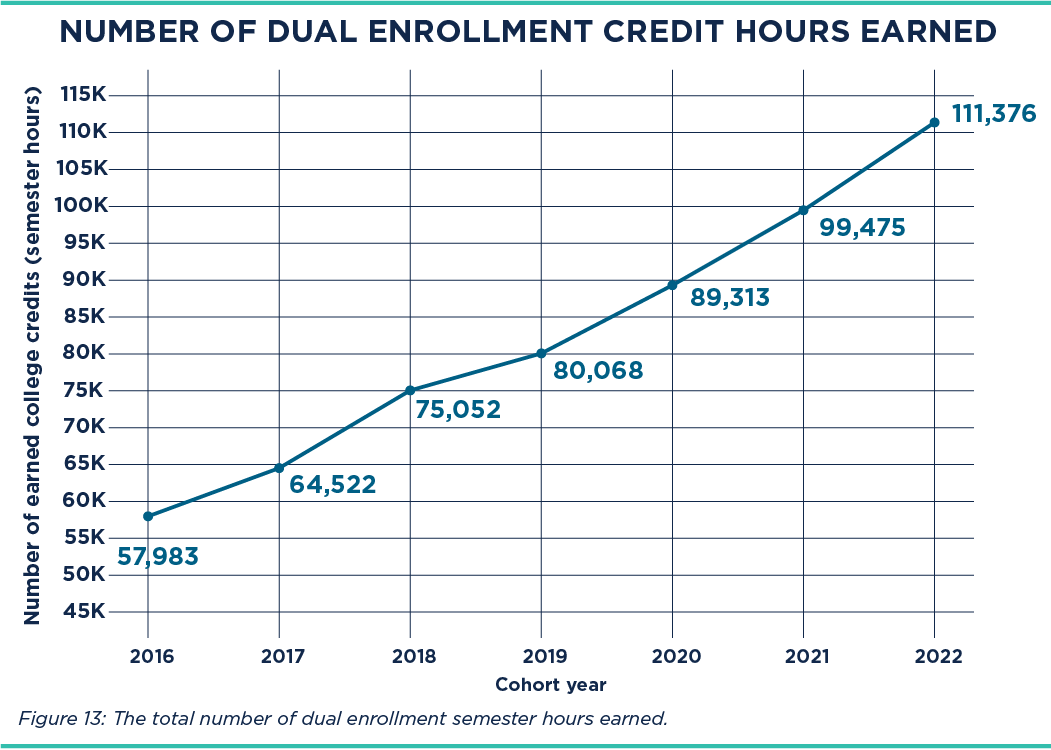
2025 Dual Enrollment Credit Hours Earned
The total number of college credit hours earned by dual enrollment participants in Nebraska has climbed over time, with over 111k earned college credits in the 2022 cohort. For more on dual enrollment in Nebraska, visit:...
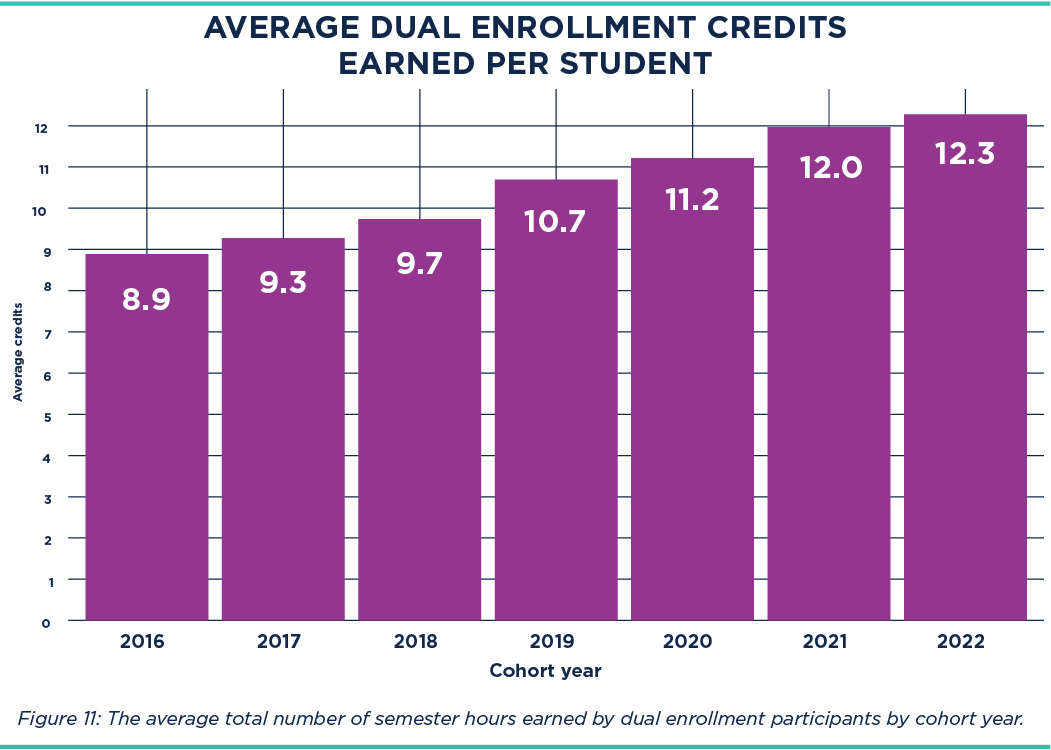
Average Dual Enrollment Credits Earned Per Student 2025
On average, Nebraska dual enrollment participants in the 2022 cohort earned 12.3 semester hours while in high school, equivalent to one full-time semester of college. This marks an increase from 8.9 semester hours in the 2016 cohort. Read more:...
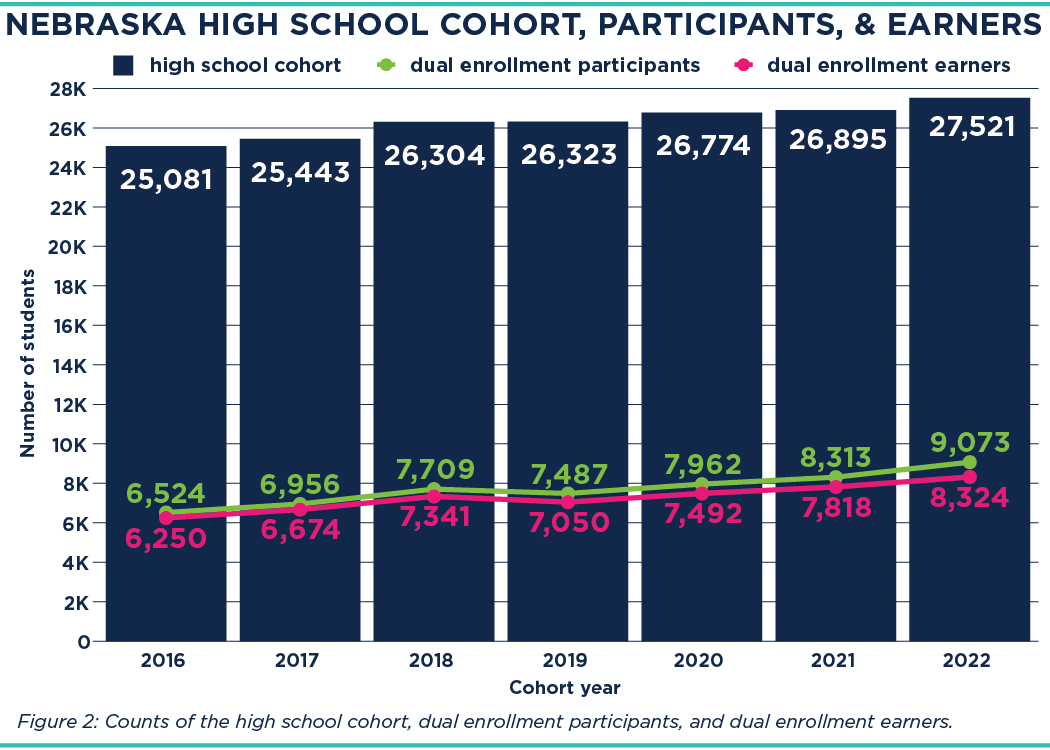
Nebraska High School Cohort, Participants, & Earners
Dual enrollment participation in Nebraska has increased significantly over time. In the 2022 cohort, 33% of students participated, up from 26% in the 2016 cohort. Read more about dual enrollment in Nebraska:...
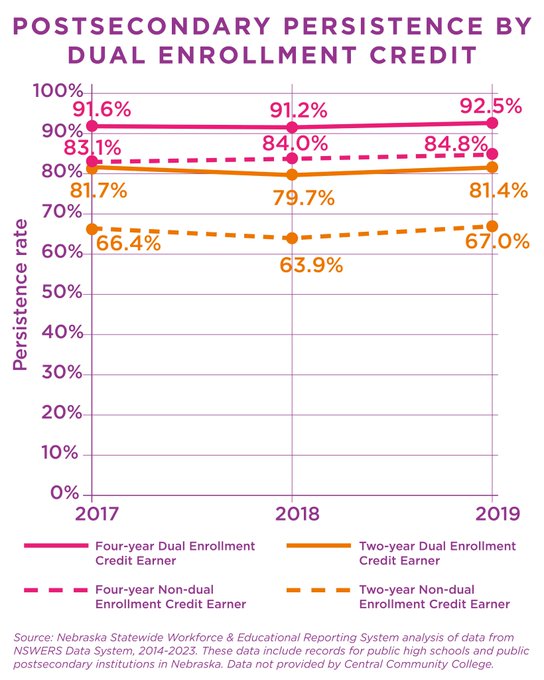
Postsecondary Persistence By Dual Enrollment Credit
Most Nebraska students persist in college for at least one year. Among dual enrollment credit earners, 92.5% persist at 4-year colleges and 81.4% at 2-year colleges. Read the dual enrollment report here:...